Your production line just stopped. Again. The same equipment that failed last month, causing missed deliveries and frustrated customers. Your maintenance team scrambles to find the problem while production schedules slip and costs mount. Sound familiar?
Unplanned downtime isn't just an operational headache—it's a profit killer that can determine whether your facility thrives or barely survives. The average manufacturing facility experiences 800+ hours of unplanned downtime annually, costing between $50,000 to $250,000 per hour depending on the operation. For a mid-sized facility, that translates to $40-200 million in annual losses.
The good news? Leading manufacturers have cracked the code on downtime reduction, achieving availability rates exceeding 95% while their competitors struggle with 75-85%. The difference isn't luck or newer equipment—it's systematic application of proven downtime reduction strategies that any facility can implement.
Understanding Your Downtime: Root Cause Analysis
You can't fix what you don't understand. The first step in any effective downtime reduction program involves systematic analysis of when, where, and why failures occur. Most facilities dramatically underestimate both the frequency and cost of their downtime because they only track major failures while ignoring the death-by-a-thousand-cuts effect of minor stoppages.
Start by categorizing all downtime events into four main buckets: equipment failures, material shortages, quality issues, and changeover/setup time. Equipment failures typically account for 40-60% of total downtime, making them the highest-impact target for improvement efforts.
Within equipment failures, focus on the 20% of equipment that generates 80% of your problems. These chronic problem machines often share common characteristics: high utilization rates, inadequate maintenance, aging components, or operating conditions that exceed design specifications.
Document failure patterns by time of day, day of week, season, and operating conditions. Many facilities discover that failures cluster around shift changes, Monday morning startups, or periods of high production pressure. These patterns often reveal root causes that extend beyond the equipment itself to include training issues, procedure gaps, or operational practices.
Calculate the true cost of each downtime event by including not just lost production, but also emergency labor premiums, expedited parts costs, quality impacts, customer satisfaction effects, and the cascading delays that ripple through the production schedule. This total cost calculation provides the business case for investing in reduction strategies.
Preventive Strategies That Actually Work
Reactive maintenance is expensive maintenance. The most effective downtime reduction strategies focus on preventing failures before they occur rather than responding faster after they happen. This shift from reactive to proactive requires systematic implementation of proven preventive approaches.
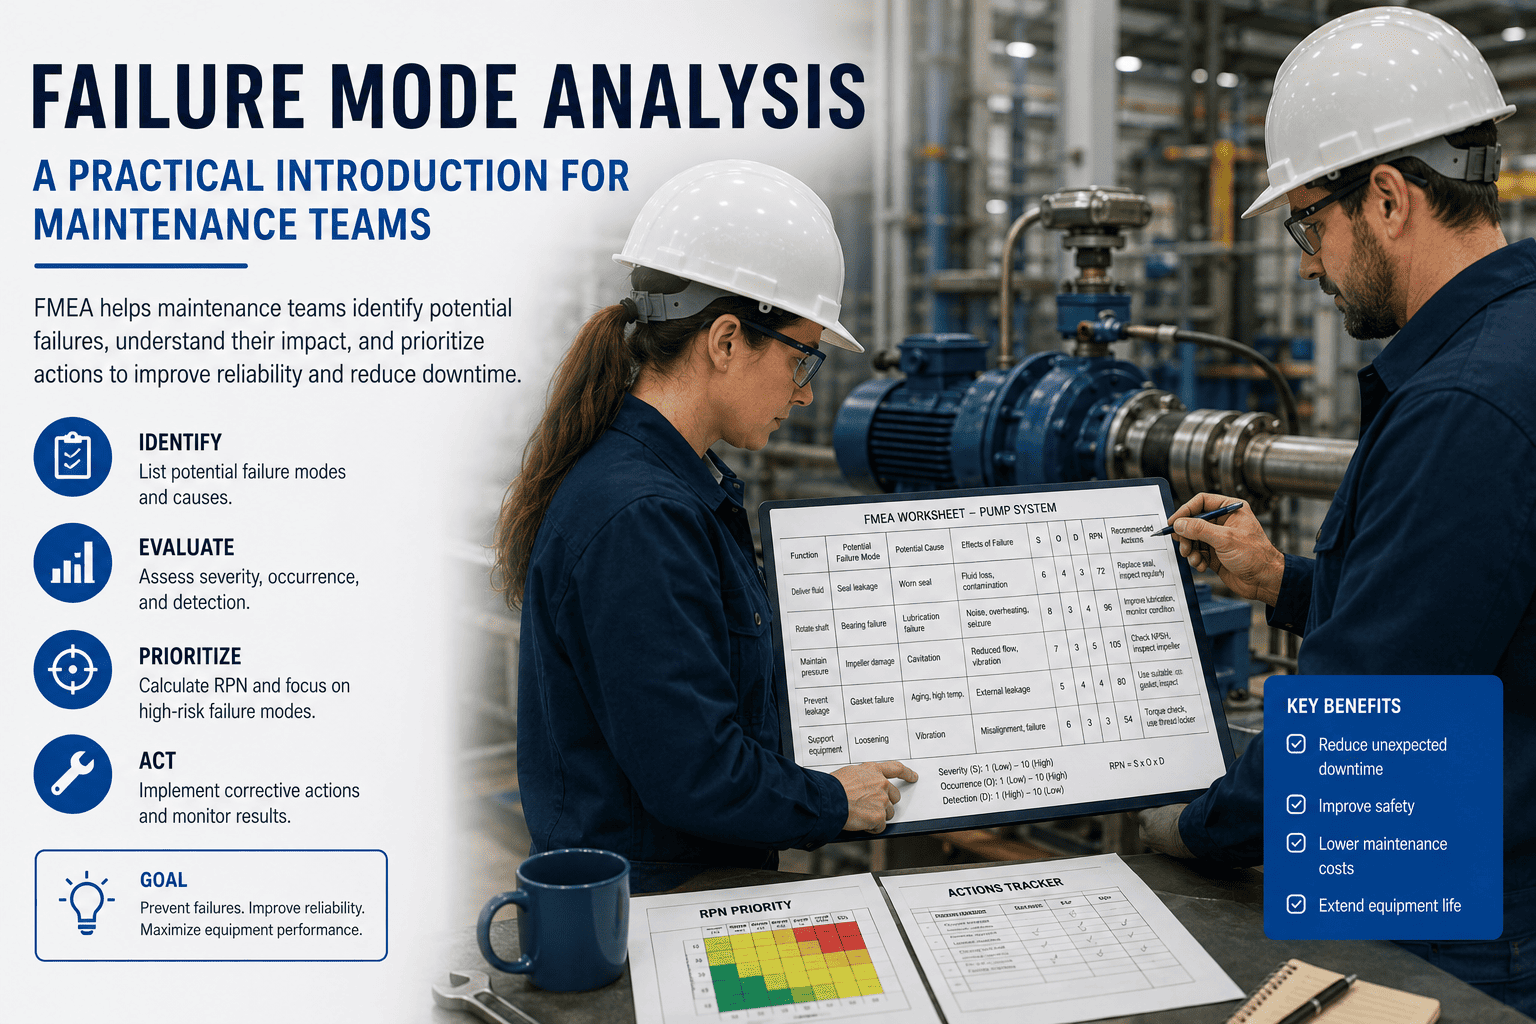
Preventive maintenance forms the foundation of any downtime reduction program. However, generic PM schedules based solely on manufacturer recommendations often miss the mark. Effective PM programs are customized based on actual operating conditions, failure history, and equipment criticality.
Start with your highest-impact equipment and develop PM schedules based on failure mode analysis. Different components require different approaches: time-based schedules work well for wear items like belts and filters, while condition-based monitoring excels for rotating equipment like motors and pumps.
Condition monitoring technologies provide early warning of developing problems. Vibration analysis can detect bearing issues weeks before failure, oil analysis reveals internal wear patterns, and thermal imaging identifies electrical problems before they cause shutdowns. The key is matching monitoring technologies to specific failure modes and establishing clear action thresholds.
Operator-driven reliability programs leverage frontline knowledge to prevent failures. Train operators to perform basic inspections, recognize abnormal conditions, and report developing problems before they cause downtime. Simple daily checks can identify 60-70% of potential failures while they're still preventable.
Critical spares management ensures that when failures do occur, repairs happen quickly. Maintain strategic inventory of high-failure, long-lead-time components for critical equipment. The cost of carrying these spares is almost always less than the cost of extended downtime waiting for emergency deliveries.
Technology Solutions for Maximum Impact
Modern technology platforms transform downtime reduction from a reactive scramble into a proactive strategy. The right technology investments can deliver 30-50% reductions in unplanned downtime while improving maintenance efficiency and extending equipment life.
Computerized Maintenance Management Systems (CMMS) provide the foundation for systematic downtime reduction. Advanced platforms track failure patterns, optimize PM schedules, manage spare parts inventory, and provide real-time visibility into maintenance activities. The key is selecting systems that match your operational complexity and organizational capabilities.
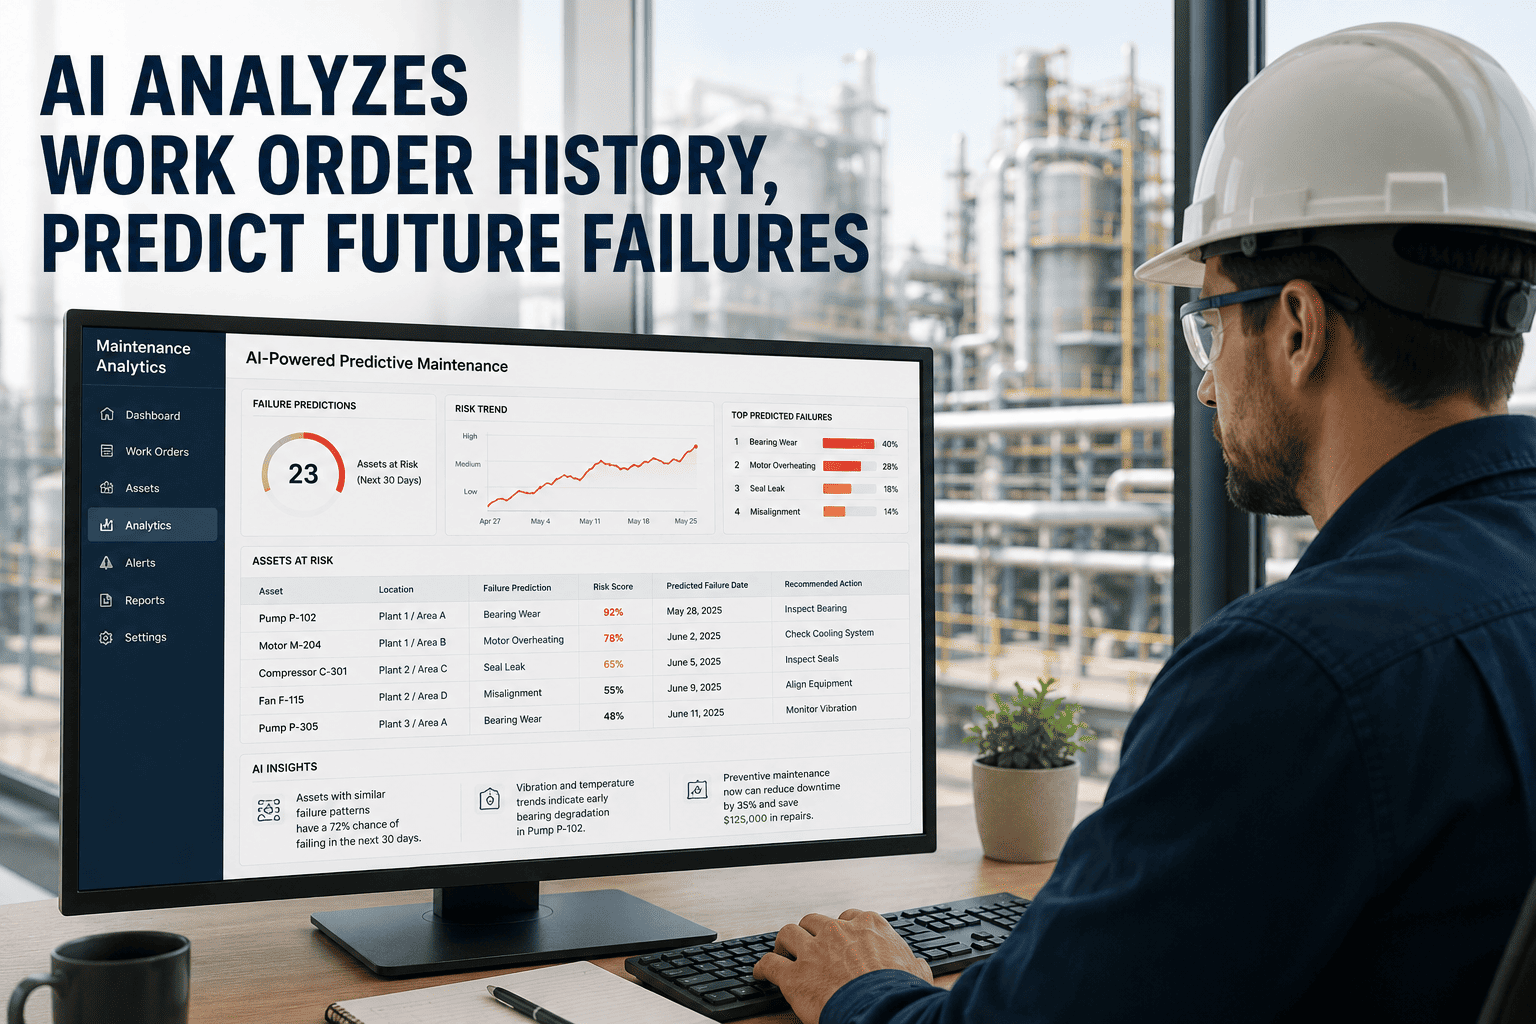
Predictive maintenance technologies use data analytics to predict failures before they occur. Machine learning algorithms analyze vibration patterns, operating temperatures, power consumption, and other parameters to identify developing problems weeks or months in advance. This advance warning enables planned maintenance during scheduled downtime rather than emergency repairs during production.
Internet of Things (IoT) sensors provide continuous monitoring of critical equipment parameters. These sensors can track everything from motor temperatures and bearing vibrations to hydraulic pressures and electrical loads. When parameters exceed normal ranges, automatic alerts enable immediate intervention before minor problems become major failures.
Mobile maintenance platforms ensure that technicians have instant access to equipment information, maintenance procedures, and spare parts locations. This mobility reduces repair time, improves maintenance quality, and enables real-time communication between maintenance and production teams.
Digital twin technology creates virtual replicas of physical equipment that enable simulation of different operating scenarios and maintenance strategies. This capability allows testing of optimization approaches without risking actual production equipment, accelerating improvement while reducing implementation risks.
Rapid Response: Minimizing Duration When Downtime Occurs
Despite the best preventive efforts, equipment failures will still occur. The difference between world-class facilities and average performers lies in how quickly they respond to and resolve these events. Rapid response capabilities can reduce the duration of unavoidable downtime by 40-60%.
Failure response procedures must be documented, practiced, and continuously improved. Develop specific response protocols for your most critical equipment that include troubleshooting steps, required tools and parts, contact information for specialists, and escalation procedures. These protocols should be easily accessible and regularly updated based on actual experience.
Emergency response teams with pre-assigned roles accelerate problem resolution. When failures occur, time spent figuring out who does what costs precious production minutes. Clear role assignments, communication protocols, and decision-making authority enable immediate action rather than delayed coordination.
Spare parts strategy directly impacts response time. Critical spares should be readily accessible with clear identification and storage procedures. Consider emergency suppliers for high-value, low-frequency items where stocking costs would be prohibitive. The key is balancing inventory carrying costs against downtime risk.
Cross-training maintenance technicians reduces dependence on individual expertise for critical repairs. While specialization has value, having multiple technicians capable of handling high-impact equipment repairs prevents bottlenecks when key personnel are unavailable.
Vendor support agreements ensure external expertise is available when needed. Establish relationships with equipment manufacturers and service providers before emergencies occur. Pre-negotiated service agreements, emergency contact procedures, and expedited parts delivery can dramatically reduce response time when specialized help is required.
Measuring Success: KPIs That Drive Improvement
Downtime reduction requires systematic measurement and continuous improvement. The right metrics provide early warning of developing problems, validate improvement efforts, and guide resource allocation decisions. Focus on metrics that drive behavior toward prevention rather than just measuring after-the-fact performance.
Overall Equipment Effectiveness (OEE) provides the comprehensive metric for equipment performance. OEE combines availability, performance rate, and quality rate into a single number that reflects total equipment productivity. World-class facilities achieve OEE scores above 85%, while average performers typically score 60-75%.
Mean Time Between Failures (MTBF) tracks equipment reliability trends over time. Increasing MTBF indicates improving reliability, while decreasing MTBF suggests developing problems that require attention. Track MTBF by equipment type and failure mode to identify specific improvement opportunities.
Mean Time To Repair (MTTR) measures response effectiveness when failures occur. Decreasing MTTR indicates improving response capabilities, while increasing MTTR suggests resource constraints or procedural problems. Break down MTTR into detection time, response time, and repair time to identify specific improvement targets.
Planned versus unplanned maintenance ratios indicate the maturity of your maintenance program. Leading facilities achieve 80-85% planned maintenance, while reactive operations may have 50-60% unplanned maintenance. This ratio directly correlates with equipment reliability and maintenance cost-effectiveness.
Schedule compliance rates measure how well maintenance activities are executed as planned. Low compliance rates often indicate resource constraints, competing priorities, or unrealistic scheduling. Target compliance rates above 85% for routine maintenance activities.
Leading indicators like PM completion rates, operator inspection compliance, and condition monitoring alert response times provide early warning of potential problems. These metrics enable proactive intervention before reactive indicators like MTBF and downtime frequency show deterioration.
Conclusion
Downtime reduction isn't about implementing a single solution—it's about building a comprehensive system that prevents failures, responds rapidly when they occur, and continuously improves based on systematic measurement. The facilities that excel in downtime reduction treat it as a strategic capability rather than a tactical response.
The path forward requires commitment to understanding your specific downtime patterns, implementing appropriate preventive strategies, leveraging technology solutions that match your operational complexity, and building rapid response capabilities for unavoidable failures. Most importantly, it requires systematic measurement and continuous improvement based on actual data rather than assumptions.
The manufacturing landscape has never been more competitive. Customer expectations for on-time delivery continue rising while margins remain under pressure. In this environment, facilities that master downtime reduction gain sustainable competitive advantages through superior reliability, predictable operations, and optimized costs.
Start with your highest-impact equipment and biggest pain points. Implement systematic tracking, develop targeted prevention strategies, and build response capabilities that minimize duration when failures occur. The investment in downtime reduction typically pays for itself within 6-12 months while building capabilities that deliver value for years.
Remember that downtime reduction is a journey, not a destination. The most successful facilities continuously evolve their approaches based on changing equipment, operational requirements, and available technologies. This commitment to continuous improvement ensures that downtime reduction capabilities remain aligned with business objectives and continue delivering competitive advantage.