
Predictive maintenance in oil & gas replaces calendar-based routines with signal-driven interventions — you fix compressors, pumps, and turbines when their condition data tells you to, not when a schedule dictates. For an industry where a single unplanned shutdown can exceed $1M per day, shifting from reactive to condition-based maintenance typically cuts unplanned downtime by 30–50% and reduces maintenance spend by 15–25%. This guide covers the predictive techniques that actually work on upstream, midstream, and refinery assets — vibration analysis, oil analysis, thermography, ultrasonic inspection, and IoT-based condition monitoring — and shows how OxMaint turns those sensor signals into automatic work orders before failure escalates. Ready to deploy your PdM program? Start Free Trial and connect your first asset in under an hour.
What if your critical assets warned you before they failed?
Oil & gas reliability teams lose millions to unplanned downtime every year. A smart predictive maintenance program catches bearing degradation, lubricant breakdown, and thermal faults 3–8 weeks before catastrophic failure — giving you time to plan, schedule, and repair without disrupting production.
unplanned O&G shutdown —
per day
Best Predictive Maintenance Techniques for Oil & Gas Assets
Not every technique fits every asset. The most effective oil and gas predictive maintenance programs layer 4–5 complementary technologies — each targeting a distinct failure mode. Here is what to deploy, where, and what failures each one catches before a work order is ever needed.
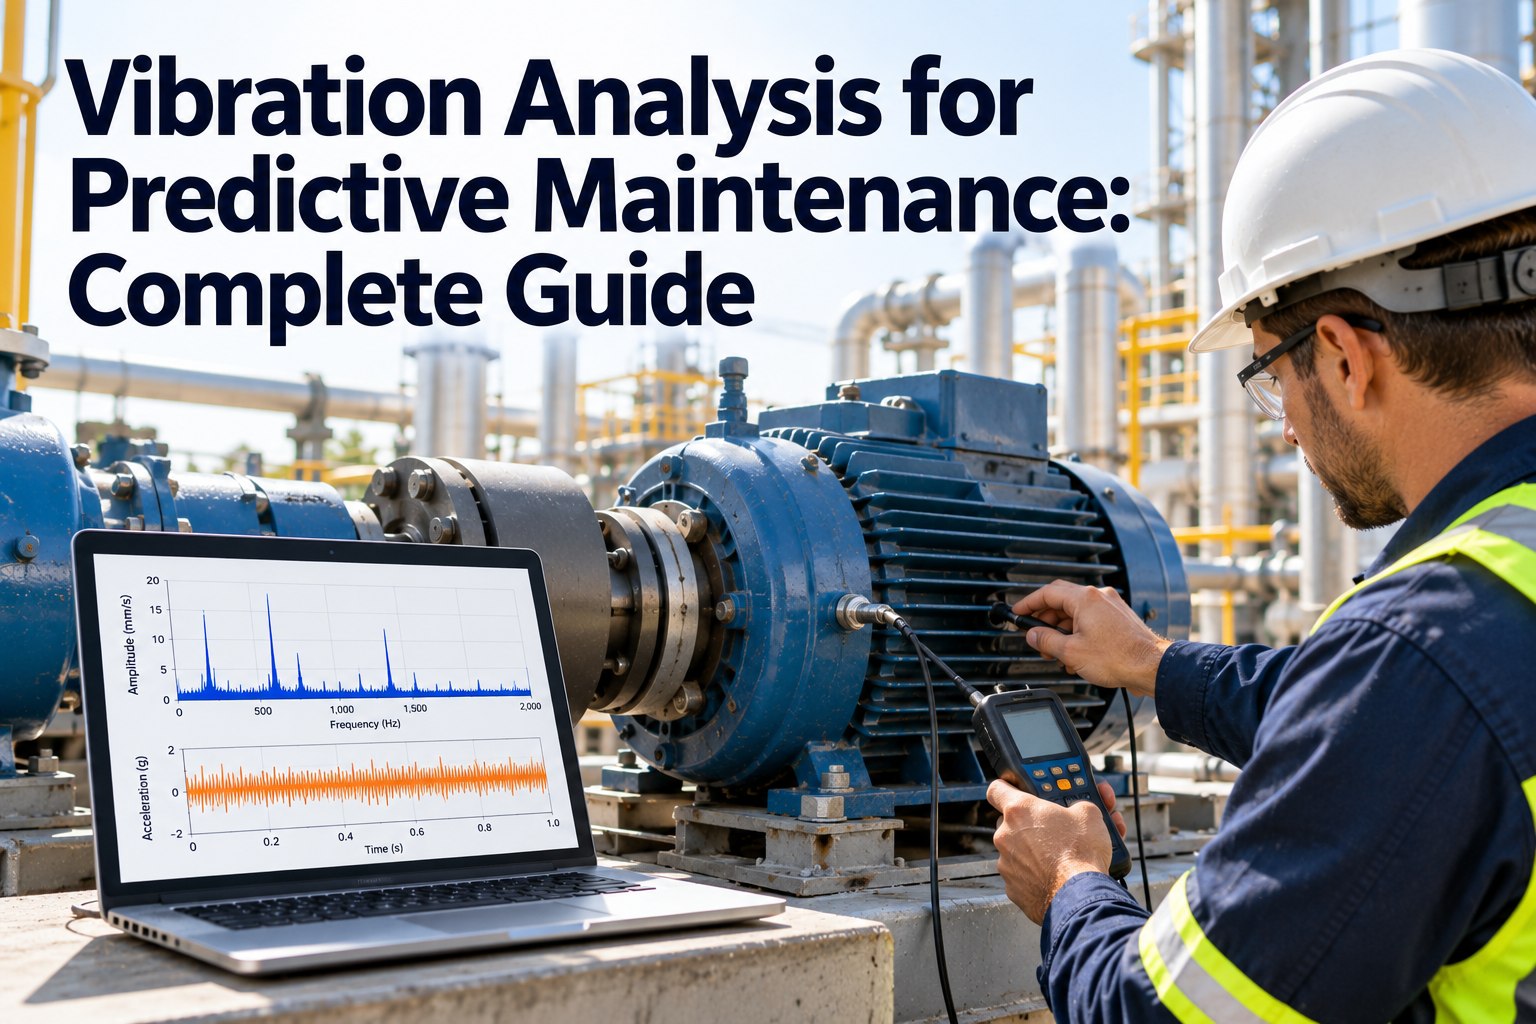
Vibration Analysis
Centrifugal pumps, gas compressors, motors, turbines, and gearboxes. Accelerometers detect bearing wear, misalignment, imbalance, and shaft cracks 3–8 weeks before failure. The highest-ROI technique for O&G — a single avoided compressor failure saves $80K–$220K in lost production and emergency repair.
Oil & Lubricant Analysis
Spectrometric and ferrographic analysis on gear oil, hydraulic fluid, and engine lubricants. Detects metal particle contamination, viscosity loss, and water ingress that vibration cannot catch early. Critical for heavy-duty reciprocating compressors, drilling rig top drives, and gas engine packages.
Infrared Thermography
Thermal imaging on switchgear, transformers, motor control centers, and steam-trap networks. Identifies loose connections, overloaded circuits, and blocked steam traps — faults invisible to vibration or oil analysis. A 30-minute IR scan of a substation can prevent a $500K+ electrical fire.
Ultrasonic Inspection
Airborne and contact ultrasonic sensors detect compressed-air and steam leaks, partial discharge in switchgear, and early valve reciprocation faults. A single 1/4-inch steam leak at 100 psi wastes $3,000–$8,000 annually. Ultrasonic surveys typically pay for themselves in under 90 days.
IoT Condition Monitoring
Wireless sensor networks on remote wellhead controllers, pipeline booster stations, and unstaffed offshore platforms. Continuously streams temperature, pressure, vibration, and flow data. Enables 24/7 early fault detection on assets no technician visits more than monthly.
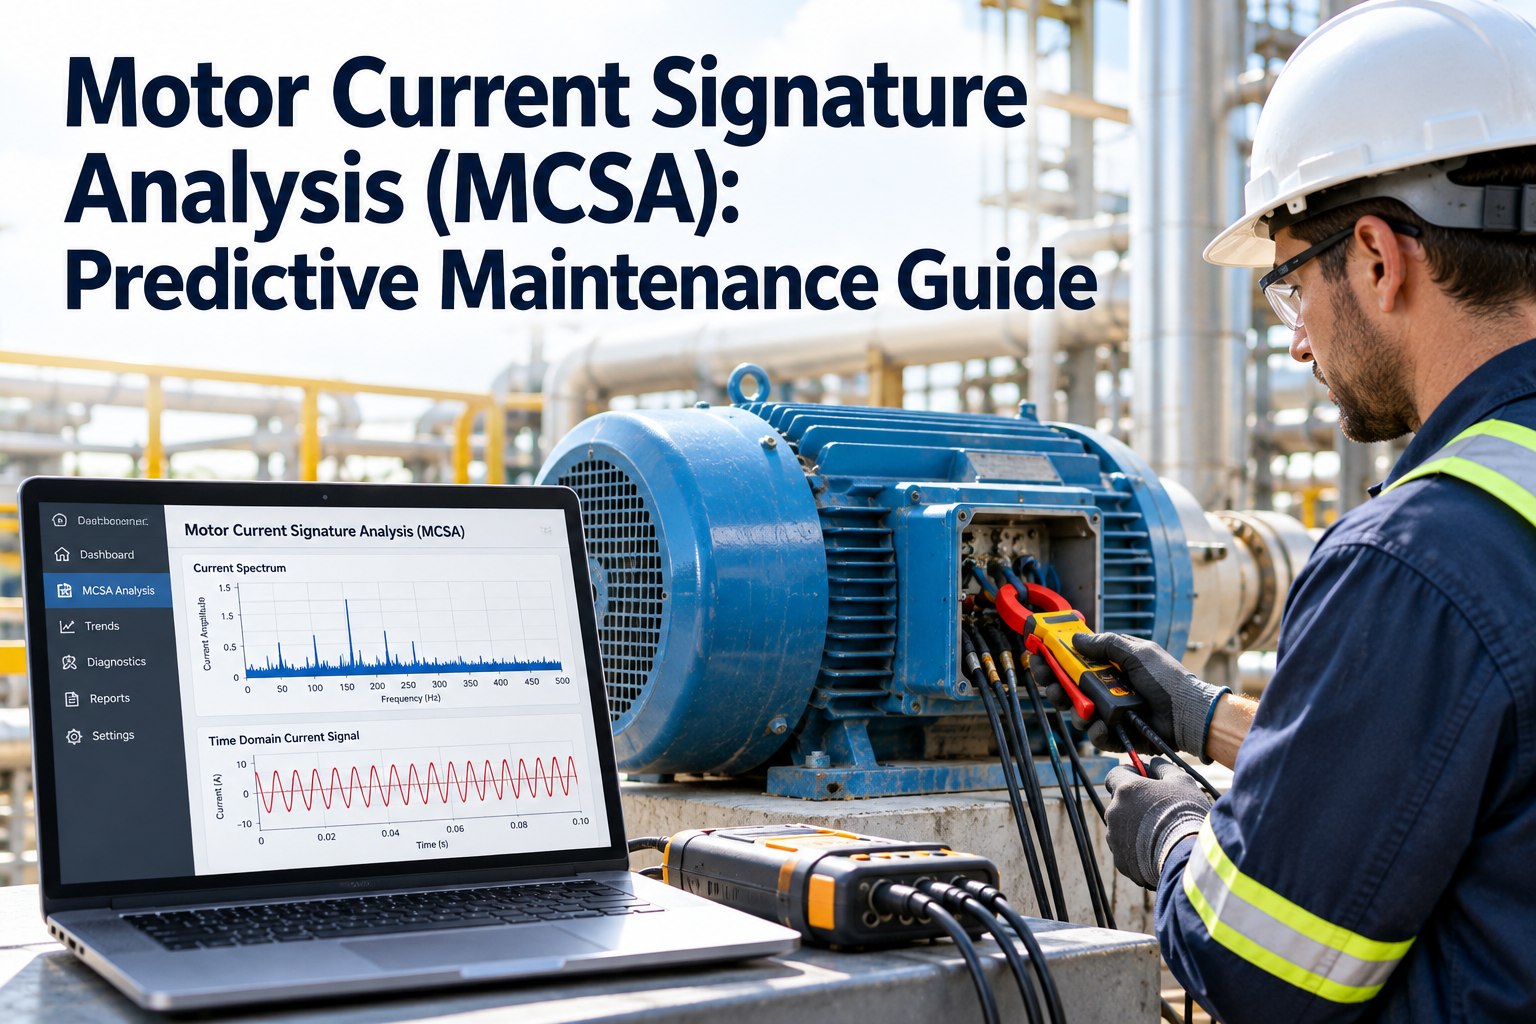
Motor Current Signature
MCSA analyzes motor current waveforms to detect rotor bar degradation, stator winding faults, and load-driven mechanical issues — without installing sensors on the machine itself. Ideal for submerged or hazardous-area motors where physical sensors are impractical.
Oil & Gas Condition Monitoring: Sensor Data to Work Order
Condition monitoring is only valuable if it triggers action. Each predictive sensor type produces a specific signal pattern; when readings cross a pre-defined threshold, OxMaint auto-generates a work order with the failure mode, recommended repair steps, and required spare parts attached — before the technician walks to the asset.
| Sensor / Technique | What It Measures | Early Fault Detected | Lead Time | Action Trigger in OxMaint |
|---|---|---|---|---|
| Triaxial Accelerometer | Vibration velocity (mm/s), acceleration (g), frequency spectrum | Bearing spalling, misalignment, gear tooth pitting | 3–8 weeks | ISO 10816 threshold breach → auto-create corrective WO |
| Oil Sample Lab / Inline Sensor | Particle count, metals (Fe, Cu, Pb), viscosity, water % | Lubricant degradation, gear wear, coolant ingress | 4–12 weeks | Particle count > ISO code 18/16 → oil-change WO + root-cause task |
| Thermal Imaging Camera | Surface temperature differential (ΔT) | Loose electrical connections, blocked steam traps | 2–6 weeks | ΔT > 15°C above ambient → inspection WO with IR image attached |
| Ultrasonic Sensor | dB level (kHz range), acoustic emission | Compressed-air leaks, partial discharge, valve blow-by | 1–4 weeks | dB reading > 8 dB above baseline → leak-repair WO |
| IoT Multi-Sensor Node | Temp, pressure, vibration, flow (continuous stream) | Process deviation, cavitation, thermal overload | Hours–days | Any channel exceeds 2-sigma band → critical-priority alert + WO |
| Motor Current Signature | Current waveform FFT, pole-pass frequency | Rotor bar break, stator winding short, eccentricity | 4–10 weeks | Pole-pass sideband amplitude > -45 dB → motor assessment WO |
From Missed Alert to Scheduled Repair — a Midstream Operator
A midstream pipeline operator running 14 booster stations with 180 critical rotating assets was spending $42K/yr on calendar-based preventive maintenance — yet still absorbing 3–4 unplanned compressor shutdowns annually at $95K each. Their PdM vendor delivered monthly vibration reports by email, but nobody owned the follow-up. Alerts sat in inboxes. Failures happened anyway.
- Monthly vibration reports delivered as PDFs via email
- No threshold-based alerts — just trending graphs
- Technicians discovered faults during rounds, not from data
- 3–4 unplanned compressor failures/yr = $285K–$380K lost
- PM compliance at 68% — tasks skipped during turnarounds
- Sensor data ingested live; thresholds set per asset class
- Breach → auto work order in 8 seconds with failure mode attached
- Technicians arrive with diagnosis, parts list, and repair procedure
- 1 unplanned failure in 18 months → $190K+ saved in downtime
- PM compliance climbed to 94% — dashboards visible to operations
Net result: the operator's PdM program paid for itself on the first avoided shutdown — and OxMaint ensured every warning became a scheduled repair, not a missed alert.
How to Build an Oil & Gas PdM Program in 6 Months
A predictive maintenance program that delivers ROI doesn't happen overnight — but it doesn't take years either. Most O&G operators reach measurable downtime reduction within two quarters by following this phased approach, each milestone building on the last.
Asset Criticality & FMEA
Rank all assets by production impact, safety risk, and environmental consequence. Run FMEA on the top 15–20% (critical rotating equipment). Identify the dominant failure modes each asset class exhibits — this determines which predictive technology to deploy where.
Baseline Data Collection
Install sensors — triaxial accelerometers on critical pumps/compressors, IoT nodes on remote wellheads. Capture 30–60 days of baseline vibration, temperature, and pressure data. Establish normal operating envelopes and 2-sigma statistical alarm bands per asset.
Threshold & Alert Configuration
Translate ISO 10816 vibration limits, oil cleanliness codes (ISO 4406), and thermal ΔT thresholds into OxMaint condition-based triggers. Each threshold breach maps to a specific work-order template with failure mode, priority, parts list, and repair procedure pre-attached.
Automated Work-Order Generation
Go live with auto-generated corrective work orders. When a sensor reading crosses threshold, OxMaint creates the WO, assigns it to the right technician based on skill and availability, reserves spare parts from inventory, and notifies the reliability engineer for review.
Reliability Analytics & KPIs
Begin tracking mean time between failures (MTBF), mean time to repair (MTTR), planned-to-unplanned maintenance ratio, and OEE per asset. OxMaint dashboards surface trends — which assets are degrading fastest, which failure modes recur, where to focus the next PdM investment.
Expand & Optimize
Extend coverage to the next tier of assets. Tune thresholds to reduce false positives — typically 10–15% of alerts need recalibration in the first quarter. Integrate predictive triggers with the turnaround planning calendar so flagged repairs batch into scheduled outages.
How OxMaint Connects Predictive Signals to Action
Most oil and gas condition monitoring tools stop at the alert — a dashboard, an email, a red dot. OxMaint goes further: it ingests sensor data, applies threshold logic, and automatically generates a fully-populated work order before a human ever has to intervene. That is the difference between a warning and a repair.
Sensor Data Ingestion
Connect vibration sensors, oil analysis labs, IoT nodes, and SCADA tags through open APIs. OxMaint normalizes all incoming streams into a single asset health timeline — no more jumping between 4 vendor dashboards to understand one machine.
Condition-Based Triggers
Set per-asset thresholds using ISO 10816, ISO 4406, or custom statistical bands. When a reading crosses the limit, OxMaint fires in under 10 seconds — not a passive alert, but an active work-order creation event with the correct failure mode pre-tagged.
Auto-Created Work Orders
Each triggered event generates a complete work order — failure mode, recommended repair steps, required spare parts, safety permits, and assigned technician. The team arrives at the asset with a diagnosis already in hand, not a blank task to investigate.
Reliability Analytics
Track MTBF, MTTR, planned-maintenance percentage, and OEE per asset class. OxMaint's AI surfaces degradation trends and recurring failure modes so reliability engineers can shift from firefighting to proactive asset-life optimization and RCM-driven strategy.
Predictive Maintenance ROI for Oil & Gas: The Numbers
A well-deployed PdM program is one of the few investments in oil and gas maintenance that pays for itself within the first avoided event. The formula below shows the core calculation — plug in your own asset count, failure frequency, and downtime cost to see the break-even point.
| Metric | Reactive (Baseline) | Preventive (Calendar) | Predictive + OxMaint |
|---|---|---|---|
| Unplanned failures per year | 6–8 | 3–4 | 1–2 |
| Average MTTR | 14 hours | 9 hours | 5–6 hours |
| PM compliance rate | ~50% | 70–75% | 90–95% |
| Annual maintenance cost (180 assets) | $85K | $42K | $28K |
| Spare-parts inventory carrying cost | High (emergency stock) | Moderate | Optimized (demand-driven) |
| Audit & compliance readiness | Poor — paper-based | Partial — inconsistent records | Full digital trail, ISO 55000-aligned |
Every Warning Should Become a Scheduled Repair — Not a Missed Alert
See how OxMaint connects your predictive sensors to automated work orders. Book a 30-minute demo and we will map it to your top 5 critical assets.
Oil & Gas Predictive Maintenance — Frequently Asked Questions
What is predictive maintenance in oil & gas?
Predictive maintenance in oil & gas uses sensor data — vibration, oil analysis, thermography, ultrasonic, and IoT condition monitoring — to detect equipment degradation weeks before failure. Instead of repairing on a fixed schedule or after breakdown, teams intervene when condition readings cross a threshold, reducing unplanned downtime by 30–50% and cutting maintenance spend by 15–25%. OxMaint automates the bridge between sensor signal and work order so no alert goes unacted upon.
How does vibration analysis work for oil and gas rotating equipment?
Triaxial accelerometers mounted on pump and compressor bearing housings measure vibration velocity (mm/s) and frequency spectra. Each failure mode produces a characteristic signature — bearing defect frequencies, gear mesh harmonics, or 1× rpm peaks for imbalance. Analysts compare spectra against ISO 10816 limits and baseline trends; when amplitudes cross threshold, OxMaint auto-generates a corrective work order with the diagnosed failure mode and repair steps attached.
How much does a predictive maintenance program cost for an oil & gas operator?
A typical 180-asset program costs $20K–$35K annually for sensors, software, and analyst labor. With a single avoided compressor shutdown saving $80K–$220K, most programs pay back in under 6 months. You can Start Free Trial of OxMaint to model your own ROI, or book a demo and we will build a customized payback calculation for your asset base.
What is the difference between RCM and predictive maintenance in oil & gas?
Reliability-Centered Maintenance (RCM) is a strategic framework for deciding what maintenance strategy each asset deserves — run-to-failure, preventive, or predictive — based on failure modes and consequences. Predictive maintenance is one execution tactic within that strategy. OxMaint supports both: RCM analysis determines which assets get sensors, and the PdM module executes the condition-based triggers and work orders those decisions produce.
Which oil & gas assets should be monitored with predictive sensors first?
Start with the top 15–20% of assets ranked by production impact, safety risk, and downtime cost — typically critical centrifugal compressors, mainline pumps, gas turbines, and high-voltage transformers. These assets have the highest failure consequences and the fastest payback. Expand to secondary assets (motors, gearboxes, switchgear) once the program is stable and thresholds are tuned — usually month 6 of deployment.
Deploy Predictive Maintenance That Pays for Itself
OxMaint connects your sensors, thresholds, and work orders in one AI-powered CMMS — built for oil & gas reliability teams that cannot afford another missed alert.
Free 14-day trial · No credit card




.png)
