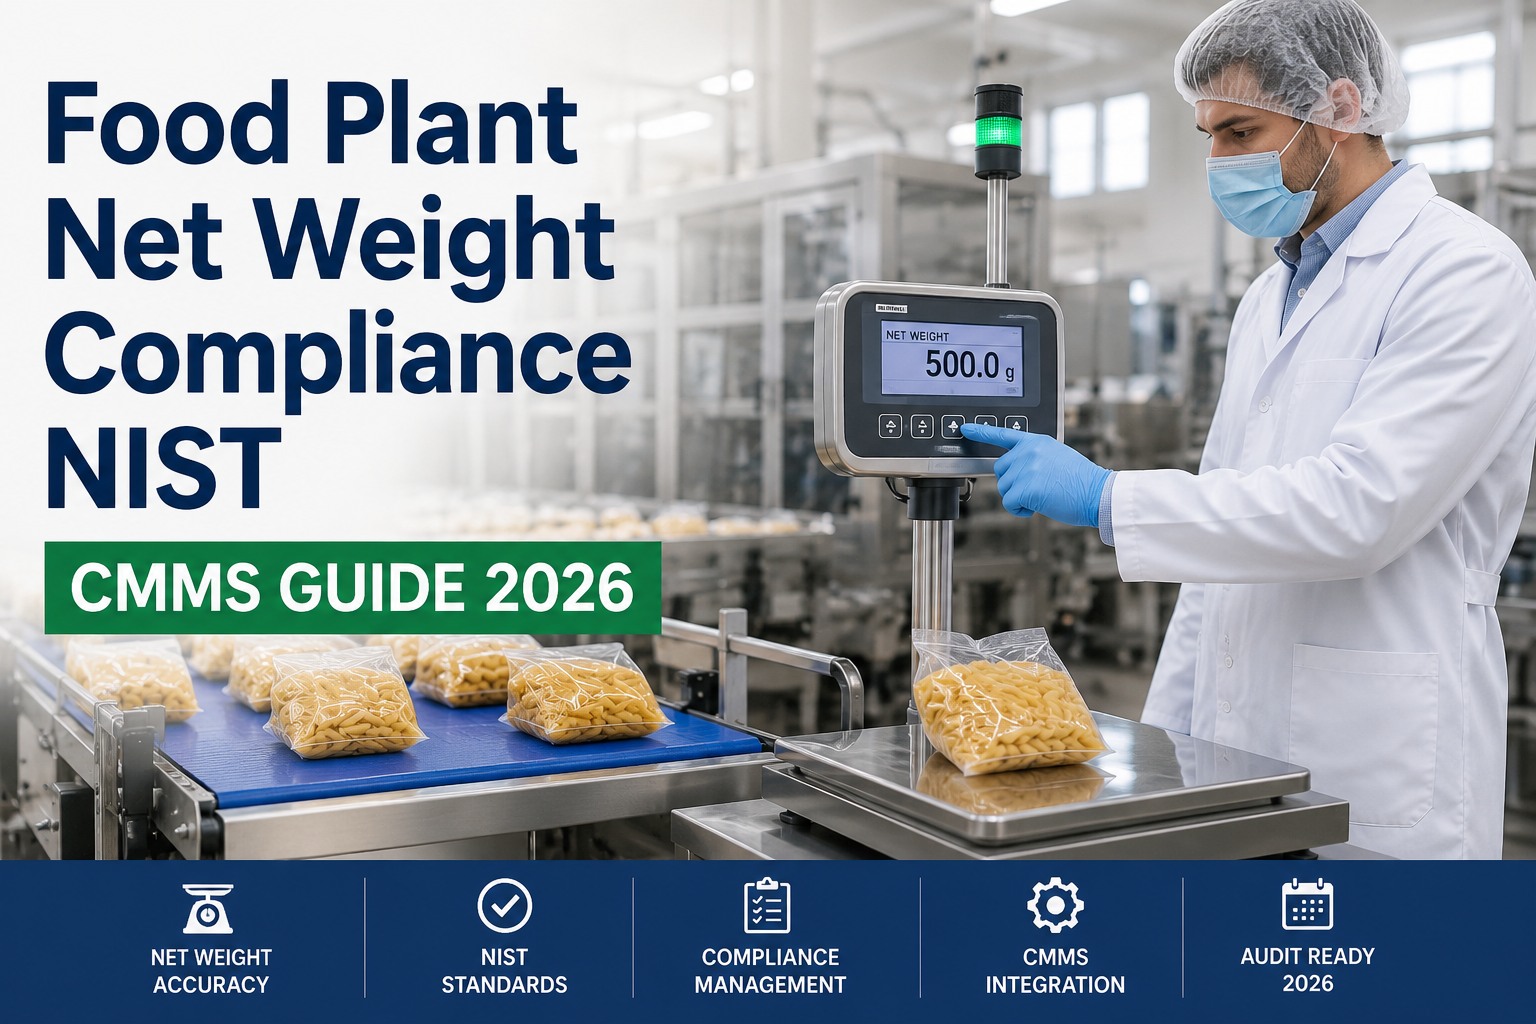
Edible oil processing runs on continuous, high-temperature process equipment where a single deodorizer trip or filling-line jam can put an entire day's output at risk — of yield loss, of quality rejection, or of a food-safety hold. Refineries operate at 220–260°C under deep vacuum, hydrogenation reactors work pressurized with hydrogen, and downstream bottling lines fill 6,000–24,000 bottles per hour with fill-weight tolerances of ±1%. Every stage demands a maintenance program that is proactive, documented, and audit-ready across FSMA, BRC, and SQF. This guide walks the equipment priorities from extraction through refining to packaging, and shows the CMMS-driven program that ties the whole edible oil plant together — with the metrics, checklists, and financial recovery a mid-size refinery can expect in year one.
One Maintenance Platform for Extraction, Refining, and Bottling
Purpose-built PM libraries for deodorizers, hydrogenators, presses, and filling lines — with FSMA-ready records, calibration logs, and downtime analytics live in one dashboard.
$14,200
Average hourly cost of unplanned downtime on a mid-size continuous edible oil refinery — steam, catalyst, and yield loss compound with every hour offline
220–260°C
Deodorizer operating temperature under 2–4 mbar vacuum — the harshest sustained thermal duty in the plant, and the equipment most sensitive to lapsed PMs
93%
PM adherence rate for plants running a CMMS versus 67% on paper — the difference that separates audit passes from FSMA findings
Why Edible Oil Maintenance Is Different From General Food Processing
An edible oil plant is not one process — it is three chained processes with three different maintenance regimes. Seed pretreatment and extraction is mechanical and dusty. Refining is high-temperature, high-vacuum, and chemically active. Packaging is high-speed and sanitation-critical. A single generic PM program applied across all three is the fastest route to missed inspections and unplanned trips.
Reason 01
Continuous Operation, Compounding Losses
Refineries run 24/7 by design. Every unplanned hour offline loses steam preheat, drops catalyst temperature, and forces re-warm-up cycles that can stretch a 2-hour repair into a 6-hour production gap.
Reason 02
Thermal & Vacuum Extremes
Deodorizer trays, packed columns, and heat exchangers cycle between 230–260°C service and cold cleaning. Gasket fatigue, tray warping, and vacuum leaks appear silently until they hit the product.
Reason 03
Food Safety Traceability
3-MCPD and glycidyl ester limits, FSMA preventive controls, and BRC/SQF audits all require timestamped maintenance and calibration evidence — the kind spreadsheets fail to produce reliably at audit time.
Reason 04
Mixed-Speed Equipment
A slow-turning expeller sits 40 metres from a filler running 200 bottles per minute. Their failure modes, PM frequencies, and skill requirements have almost nothing in common — one maintenance calendar cannot serve both well.
The Edible Oil Plant Value Chain — Where Maintenance Lives
A CMMS earns its keep by knowing that Stage 2 equipment fails differently from Stage 5 equipment. The pipeline below maps the six operating stages of a full edible oil plant, the dominant equipment at each stage, and the single failure mode that most often triggers unplanned downtime — the failure mode your PM program should be built to prevent first.
01
Seed Prep
Cleaners · De-stoners · Flakers · Cookers
Dominant failure: bearing wear from grit ingress and thermal cycling
02
Extraction
Screw presses · Solvent extractors · Desolventisers
Dominant failure: worm-shaft scoring and press-cage clogging
03
Refining
Degumming · Neutralization · Centrifuges · Bleaching
Dominant failure: centrifuge bowl fouling and heat exchanger scaling
04
Deodorization
Vacuum column · Steam jets · Economizers · Coil boiler
Dominant failure: vacuum leaks and tray fouling driving off-spec taste/color
05
Modification
Hydrogenators · Interesterification · Winterization · Fractionation
Dominant failure: catalyst poisoning and reactor seal degradation
06
Packaging
Volumetric fillers · Cappers · Labelers · Case packers
Dominant failure: nozzle drip, seal wear, and fill-weight drift
The High-Consequence Equipment — Where PM Discipline Pays the Most
Not all equipment carries the same downtime consequence. The four assets below are the ones where a lapsed PM turns into a shift-length production stop, a batch quality rejection, or a food-safety hold. Build the PM program around these first, and the rest of the plant benefits from the reliability halo.
A1
Deodorizer Vacuum System
Steam ejectors, condensers, and vacuum piping must hold 2–4 mbar for the deodorizer to strip volatiles and hit taste, colour, and free-fatty-acid targets. A single air leak lifts pressure, extends residence time, and drives 3-MCPD formation — a food-safety failure invisible until lab QC catches it hours later.
PM cadence: weekly leak-down test · monthly ejector nozzle inspection · quarterly condenser tube clean
A2
Hydrogenation Reactor
Pressurised hydrogen service under nickel catalyst. Seal degradation, catalyst carryover, and heat-exchanger fouling all compound into batch consistency drift. Reactor maintenance touches hazardous-area electrical work, hydrogen leak detection, and confined-space entry — all of which need permit trails only a CMMS can produce cleanly for audit.
PM cadence: per-batch mechanical seal check · monthly catalyst dosing calibration · annual reactor internals inspection
A3
Neutralization Centrifuges
The refining bottleneck. Bowl fouling from soap and gum drops separation efficiency, which drags neutral-oil loss up by 0.5–1.5% — a six-figure yield hit over a quarter. CIP effectiveness depends on nozzle condition, disc-stack cleanliness, and drive-side bearing integrity, all of which are runtime-hour driven, not calendar driven.
PM cadence: shift-end CIP verification · every 2,000 runtime hours disc inspection · every 8,000 hours bowl overhaul
A4
Bottling Line Filler
Volumetric and net-weight fillers run 6,000–24,000 bph. A worn piston seal or partially blocked nozzle causes ±3% fill variance — instantly a labelling compliance and giveaway-cost issue. Fill-weight drift is the single most common line stop across edible oil packaging and the fastest one to fix if the CMMS catches it in the calibration log.
PM cadence: shift-end nozzle wipe-down · weekly piston-seal check · every 3,000–6,000 runtime hours full PM
The Failure Cost Curve — Why Prevention Wins on Every Line Item
Reactive repair costs on high-consequence edible oil equipment run three to five times the cost of the same work done as planned maintenance. When steam consumption, catalyst poisoning risk, and batch rejection are added, the multiplier stretches further. The gauge below shows the four maintenance postures and the operating impact each one produces on a typical refining line.
Maintenance Posture vs. Operating Impact — Continuous Refining Line
ReactiveFix when broken
ScheduledCalendar PMs
ConditionRuntime + sensor
PredictiveTrend + AI flag
Reactive Posture
Repair cost 3–5× planned. Batch rejections common. FSMA documentation reconstructed after the fact — a red-flag pattern for auditors and a leading indicator of audit findings.
Scheduled PM Posture
Baseline safe operation. Missed calendar windows are the failure mode — spreadsheets miss 30–40% of due dates. A CMMS closes the gap without adding headcount to the maintenance team.
Condition-Based Posture
PMs tied to runtime hours, cycles, or vibration triggers. Extraction bearings, centrifuge overhauls, and filler-piston service move from calendar to condition, cutting unnecessary work and catching real wear earlier.
Predictive Posture
OxMaint trend-flags rising motor current, seal-temperature drift, or vacuum-decay slope before failure. Mid-size refineries with predictive on their top 20 assets cut unplanned downtime 30–45% in year one.
Move Your Refinery From Reactive to Predictive — On One Dashboard
Asset criticality scoring · Runtime-based PMs · FSMA-ready calibration logs · Vibration and motor-current trend flags for deodorizers, centrifuges, and fillers.
Filling and Bottling — The Line Where Every Minute Shows Up in Yield
The refinery makes the oil. The bottling line decides whether it leaves the plant on schedule. Filling and packaging equipment fails in small, frequent ways — a drip here, a jam there, a sensor coated with mist — and each micro-stop bleeds shift output. A CMMS-driven approach converts these into logged events with root causes, so the pattern behind repeat failures becomes visible and fixable.
Fill-Weight Accuracy Drift
Air ingress, blocked nozzles, or worn piston seals cause ±2–4% fill variance. Overfill costs 5 ml per bottle, which at 10,000 bottles per day compounds to $12,000+ in annual product giveaway alone.
Prevention: end-of-shift nozzle clean, weekly seal check, calibration log every 6,000 runtime hours
Nozzle Drip and Bottle Contamination
Oil residue on nozzles drips onto conveyors, contaminates labels, and creates slip hazards. It also flags an early-stage seal wear that will progress to full fill-accuracy failure within days if ignored.
Prevention: mid-shift wipe-down, weekly seal replacement threshold check, monthly nozzle deep-clean
Conveyor Jams and Sensor Blind Spots
Oil mist coats optical sensors; belts slip on driving pulleys. Line stops because the machine thinks a bottle is missing when in fact 30 are queued. Small, repeated, and almost entirely preventable with a daily 3-minute clean.
Prevention: daily sensor wipe, weekly belt-tension check, monthly pulley wear inspection
Cap Torque and Seal Integrity
Under-torqued caps leak in transit and trigger customer returns. Over-torqued caps crack. Torque calibration drift is the single most common cause of downstream complaint spikes in bottled edible oil.
Prevention: shift-start torque verification, weekly calibration, monthly capper-head service
Food Safety Integration — Where Maintenance Records Become Audit Evidence
Under FSMA preventive controls, BRC Global Standard for Food Safety, and SQF certification, maintenance and calibration records are audit evidence — not just internal housekeeping. Audit prep collapses from days to hours when the CMMS is the source of truth. The four record types below are the ones auditors ask for by name.
Record 1
Temperature and Vacuum Calibration Logs
Deodorizer temperature and vacuum sensors are critical control points. Auditors expect timestamped calibration records with technician sign-off, next-due date, and drift history. OxMaint auto-generates these from every calibration work order without a separate spreadsheet.
Record 2
Preventive Maintenance Completion Evidence
Every PM on a food-contact asset needs completion evidence with photos of before/after state, parts replaced, and technician credentials. Paper checklists lose 15–20% of this evidence. A CMMS captures it inline with the work order.
Record 3
Corrective Action and Root Cause Logs
When a failure happens, auditors want to see the corrective action, the root cause analysis, and the preventive measures added afterwards. The five-why analysis lives in the work order thread, timestamped, unedited, defensible.
Record 4
Sanitation and CIP Verification Records
Clean-in-place cycles on centrifuges, tanks, and pipelines need verification — temperature achieved, chemical concentration, contact time, rinse conductivity. Each cycle logs as a work order with attachments; audit trail is complete by design.
The Four Pillars of a CMMS-Driven Edible Oil Maintenance Program
A modern maintenance program for an edible oil plant rests on four pillars. Each pillar is executable in OxMaint from day one; each pillar produces measurable improvement within a quarter; and together they take a refinery from reactive firefighting to a documented, audit-ready operation.
Pillar 01
Asset Criticality Scoring
Every asset scored by downtime cost, food-safety consequence, and repair complexity. The deodorizer, centrifuges, hydrogenator, and lead filler always land in Tier 1 — and get Tier 1 PM frequency, spare-parts stocking, and technician-skill assignment.
Pillar 02
Runtime-Based PM Triggers
Calendar PMs miss when equipment runs hot for a month and idles the next. Runtime hours, cycle counts, and throughput volume drive the trigger. Centrifuges get service at 2,000 hours; fillers at 6,000; press worms at 4,000 tonnes throughput.
Pillar 03
Mobile Work Execution
Technicians work from the phone on the plant floor — checklists open on the asset QR scan, photos attach to the work order, parts consumption logs live, and completion sign-off happens without walking back to the office computer.
Pillar 04
Analytics and Predictive Flags
MTBF, MTTR, PM compliance, and downtime cause codes surface in one dashboard. Rising vibration on a centrifuge or motor-current drift on a filler auto-generates a work order before the failure — the difference between planned service and midnight callouts.
Financial Case — What a Mid-Size Edible Oil Plant Recovers in Year One
The maintenance ROI on an edible oil plant is not soft. It shows up in reduced steam and catalyst waste, in avoided batch rejections, in labour hours reallocated from firefighting to improvement work, and in avoided regulatory findings. The table below models a plant refining 200 tonnes per day of oil with a two-line bottling operation — a common mid-size profile.
200 TPD Edible Oil Plant — Year 1 CMMS Financial Impact
47%
Reduction in unplanned downtime hours after 12 months on OxMaint at a typical 200 TPD refinery
0.5%
Neutral oil yield recovered from disciplined centrifuge CIP and heat exchanger cleaning cadence
4 hrs
Typical FSMA audit prep time when maintenance records live in a CMMS — down from 4–5 working days on spreadsheets
65%
Maintenance cost reduction achieved by one edible oil refinery moving from ad-hoc repairs to genuine PM-driven parts stocking and scheduling
Our deodorizer was our single biggest downtime risk — 40+ unplanned hours a year, plus the batch rejections nobody wanted to count. We put the vacuum system, the ejector nozzles, and the condenser tubes on runtime-based PMs in OxMaint, and added trend flags on the vacuum-decay slope. First year we cut deodorizer downtime by 71% and passed our BRC audit with zero findings for the first time in four years.
— Maintenance Manager, 240 TPD Sunflower & Soybean Refinery · Year 1 CMMS deployment outcome
Frequently Asked Questions
CMMS for Edible Oil Plants
Give Your Deodorizer, Your Centrifuges, and Your Fillers the Maintenance Program They Deserve.