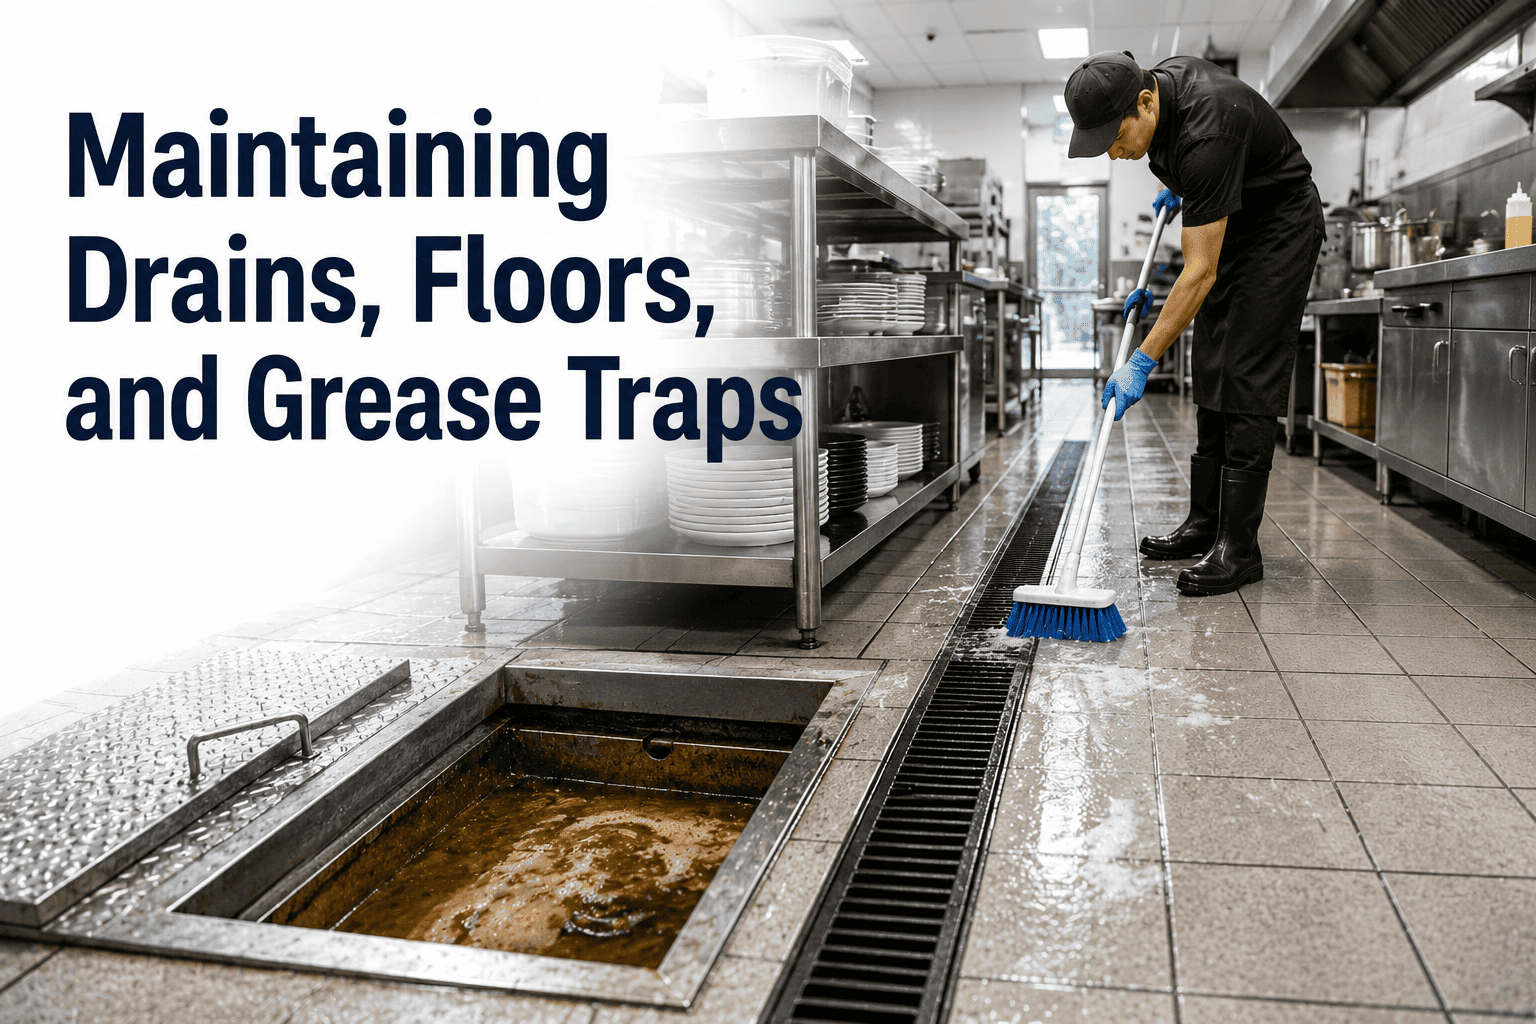
Drains, floors, and grease traps quietly carry the sanitation load of every food plant — and when they fail, environmental monitoring swabs turn positive, Listeria takes hold in harborage sites, and pest pressure follows within days. A 2024 industry review found that more than 60 percent of positive environmental Listeria findings in ready-to-eat facilities trace back to floor drains, cracked epoxy, and unserviced grease interceptors. This guide walks through the cleaning cadence, coating inspection, drain trap PM, and grease interceptor service that keep results clean — and the CMMS-driven program that ties every task to a verifiable record. If you want to skip ahead to building the work-order backbone, you can Start Free Trial and stand up a sanitation infrastructure program in an afternoon.
What if your next positive swab came from a drain nobody serviced?
Invisible infrastructure — drains, floors, and grease traps — is the single largest predictor of environmental monitoring outcomes. A CMMS-driven PM program eliminates the guesswork and the recurring finding.
The hidden cost of ignored infrastructure
A single positive environmental swab triggers root-cause investigation, hold-and-test protocol, and often a customer notification — costing a mid-size RTE plant between $18,000 and $120,000 per event before any recall exposure.
A 180-asset deli protein plant in the Midwest was spending $42,000 annually on reactive drain de-clogging, emergency pest control, and third-party sanitation re-cleans. After mapping 64 floor drains, 12 trench channels, and 3 grease interceptors into a CMMS with tiered PM cadences, the plant cut reactive costs by 71 percent in the first year and went two consecutive inspection cycles with zero environmental positives on Zone 2 swabs.
Floor drain, trench, and trap PM schedule
Different assets degrade at different rates. The schedule below reflects typical food-plant operating conditions and aligns with FDA FSMA preventive-controls expectations for sanitation monitoring.
Floor drain flush and inspection
Remove stainless-steel strainer baskets, brush the drain basin with a designated color-coded tool, and confirm water flow to the interceptor. Log drain ID, time, and technician in CMMS — a 90-second task that prevents 80 percent of blockages.
Deep clean and foam sanitation
Apply enzymatic foam to drain basins and trench channels, allow 10–15 minutes contact, and rinse with 180°F water. Verify with ATP swabbing — target less than 30 RLU on Zone 2 drain rims. Flag any reading above threshold for re-clean within 24 hours.
Floor coating and grout inspection
Walk every production zone with a CMMS checklist. Score floor coating condition on a 1–5 scale, photograph any cracks wider than 1/8 inch, and generate a repair work order before moisture breaches the substrate and harborage forms.
Grease interceptor capacity check
Measure sludge and grease layer depth with a core sampler. When combined thickness reaches 25 percent of interceptor capacity, schedule pump-out within 7 days. Record before/after measurements and hauler manifest number in CMMS for audit defense.
Waste-line camera and flow verification
Run a push-camera through main waste lines to detect scaling, grease build-up, and joint separation. Verify flow rate at the interceptor discharge against design spec — a drop of more than 15 percent triggers a hydro-jet service order.
Grease interceptor service interval, calculated
Most plants pump interceptors on a fixed calendar — and either overpay for premature service or risk overflow. Use this field formula to set a defensible, condition-based interval per asset.
Tank Capacity in gallons — read from the interceptor nameplate.
0.25 is the 25 percent combined grease-and-sludge threshold.
Daily Grease Load in gallons/day — estimated from flow meter data or the kitchen-equipment grease-production table.
A 500-gallon interceptor receiving 4 gallons/day of grease load: (500 × 0.25) ÷ 4 = 31 days. Pump every 28 days to build a safety margin. Schedule auto-generated work orders in CMMS at day 25 so the hauler arrives before the threshold is reached.
CMMS sanitation infrastructure checklist
A complete program touches five asset families. Use this tiered grid to confirm every PM is mapped, assigned, and generating closed-loop records in your CMMS.
- Every drain tagged with unique CMMS asset ID and QR label
- Daily flush log with technician, time, and photo confirmation
- Weekly enzymatic foam and ATP verification at less than 30 RLU
- Quarterly strainer and basket replacement schedule
- Channel length and slope recorded in asset profile
- Weekly deep clean with 180°F rinse and brush
- Bi-annual grout and seal inspection along channel edges
- Flow-rate check at discharge point logged monthly
- 1–5 condition score per zone, updated monthly with photos
- Cracks wider than 1/8 inch auto-generate repair work order
- Annual full re-coat assessment by certified contractor
- Substrate moisture test before any re-coat application
- Capacity, flow rate, and grease load documented per asset
- Quarterly core-sample depth measurement logged
- Pump-out triggered at 25 percent combined layer thickness
- Hauler manifest number attached to every closed work order
- Line routing map and cleanout locations in CMMS
- Annual push-camera inspection with video archived
- Hydro-jet service when flow drops more than 15 percent
- Joint and slope verification tied to annual inspection
- Environmental monitoring swab results linked to nearest drain asset
- Any positive triggers automatic drain and floor PM review
- Monthly KPI dashboard: PM completion rate above 95 percent
- Annual audit package auto-generated from closed work orders
Reactive vs. CMMS-driven maintenance
The gap between reactive and CMMS-driven programs is measurable in cost, compliance readiness, and environmental monitoring outcomes.
| Metric | Reactive Program | CMMS-Driven Program |
|---|---|---|
| PM completion rate | Below 60 percent, paper-based | 95 percent or higher, auto-tracked |
| Annual reactive spend | $42,000 typical for 180-asset plant | $12,000 — 71 percent reduction |
| Environmental positives | 2–4 per quarter on Zone 2 swabs | Zero across two inspection cycles |
| Audit prep time | 3–5 days of manual record assembly | Under 2 hours — auto-generated package |
| Pest service calls | 3× baseline frequency | Back to contracted baseline |
| Interceptor overflow risk | High — calendar-based, often too late | Near zero — condition-based trigger at 25 percent |
Turn every drain into a tracked asset this week.
Stand up a CMMS-driven sanitation infrastructure program in an afternoon — tag assets, set cadences, and start generating audit-ready records immediately.
Common questions about drain, floor, and grease trap maintenance
How often should floor drains be deep-cleaned in a food plant?
Daily flushing and visual inspection is the baseline for any Zone 2 drain. A deeper enzymatic foam clean with 180°F rinse and ATP verification should happen weekly. In high-risk RTE zones, some plants move the deep clean to a daily cadence during peak production — your CMMS should let you set different frequencies per asset, not a single plant-wide schedule.
What grease trap capacity threshold should trigger a pump-out?
Industry standard is 25 percent combined grease and sludge depth, measured by core sample. Once that threshold is reached, schedule pump-out within 7 days. Using the formula (Tank Capacity × 0.25) ÷ Daily Grease Load, you can predict the service date in advance and auto-generate the work order in CMMS so the hauler arrives before risk builds.
How do I link environmental monitoring results to drain maintenance?
Tag every floor drain with a unique asset ID and record the nearest drain asset on every environmental swab. When a positive hits, your CMMS should automatically pull the last 90 days of PM records for that drain — flushing logs, foam cleans, and ATP readings. To see this workflow in action, Book a Demo and we will walk through a live investigation.
What floor coating condition warrants an immediate repair work order?
Any crack wider than 1/8 inch, any area where the coating has delaminated from the substrate, or any visible moisture penetrating to the concrete. Score each zone on a 1–5 scale monthly — anything at 2 or below generates an automatic repair order. Delays let moisture and organic material pool beneath the coating, creating the exact harborage conditions Listeria needs.
Can a CMMS really cut reactive sanitation costs by 70 percent?
Yes — the savings come from three places: preventing the blockages that trigger emergency de-clogging calls, eliminating the third-party re-cleans that follow failed inspections, and cutting pest service calls back to contracted baseline. A 180-asset plant typically moves from $42,000 to $12,000 in annual reactive spend within the first year. You can model your own plant by signing up for a Start Free Trial and importing your asset list.
Build your sanitation backbone today.
Tag drains, set PM cadences, and generate audit-ready records in one afternoon. Join the food plants running zero-positive inspection cycles with CMMS-driven infrastructure maintenance.
Free 14-day trial · No credit card