The Chief Mechanical Engineer opens the Monday morning incident report and the numbers are brutal — a Class 66 locomotive traction motor burned out mid-haul on the East Coast Main Line because the bearing replacement was scheduled for 90-day intervals regardless of whether the unit had run 18,000 miles on gentle gradients or 42,000 miles hauling aggregate through mountain curves. The calendar said "not due," but the bearing said otherwise. The resulting line blockage delayed 14 passenger services, triggered £320,000 in Schedule 8 delay-attribution penalties, required an emergency recovery crane costing £85,000, and destroyed a £45,000 traction motor that a £900 bearing replacement would have saved. Meanwhile, in the same fleet, 40% of components replaced on calendar schedules still had 30-50% useful life remaining — representing millions in wasted parts, unnecessary depot downtime, and labour hours spent changing components that didn't need changing.
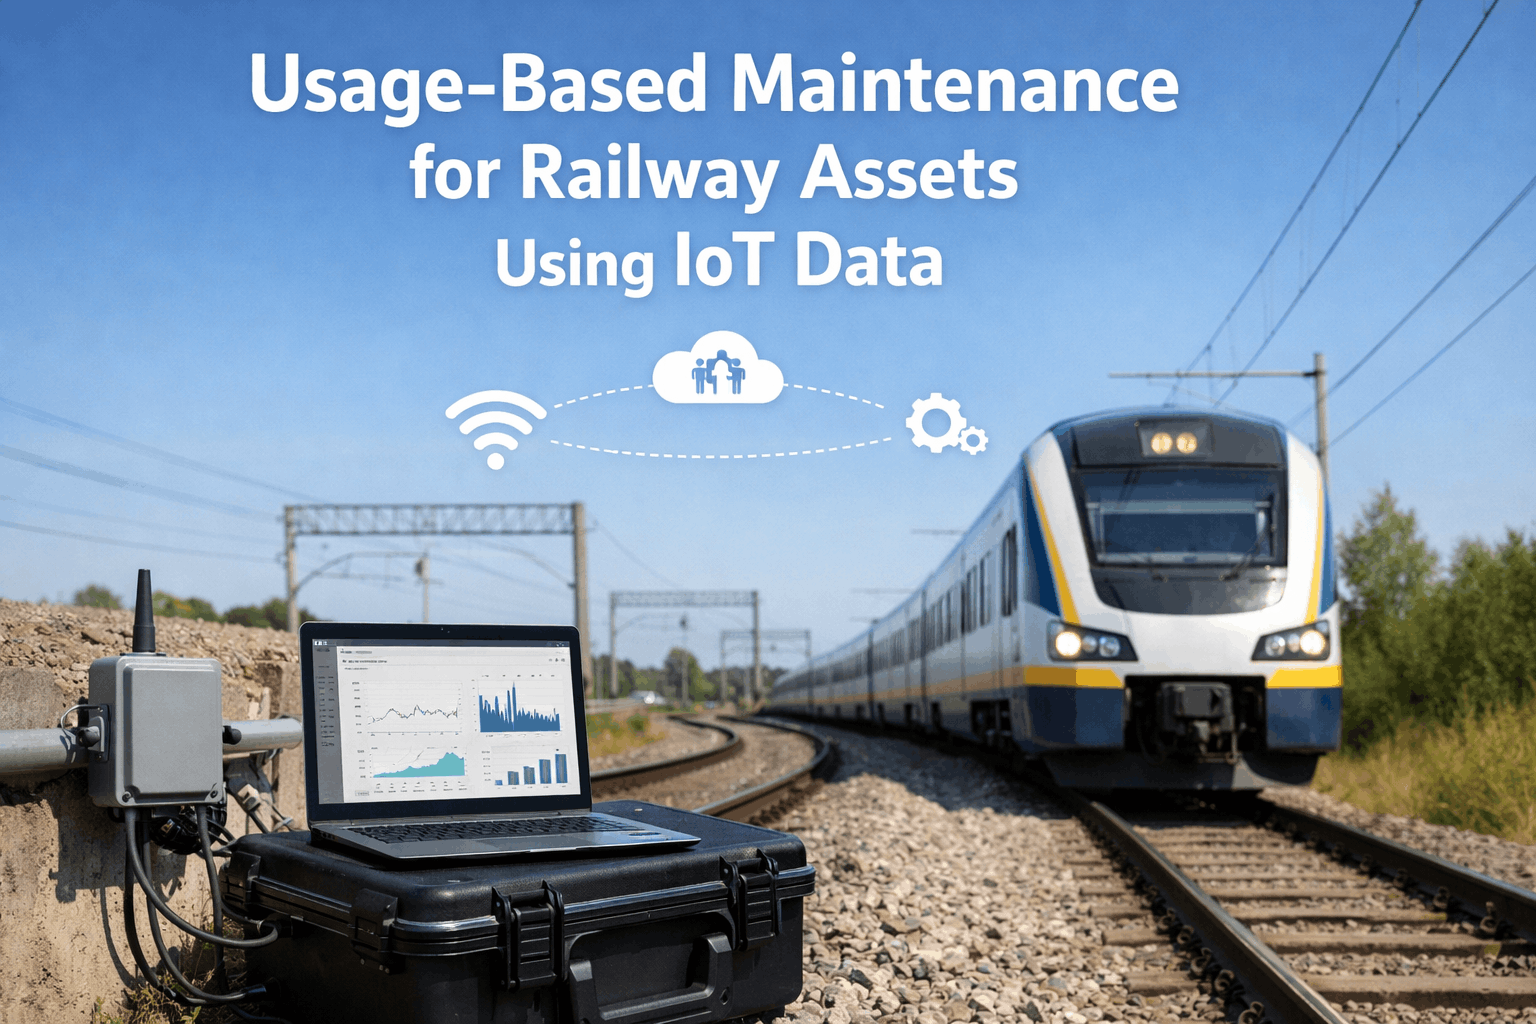
This paradox — simultaneously over-maintaining healthy assets and under-maintaining overworked ones — defines railway maintenance worldwide. Calendar-based and mileage-based schedules treat every asset identically regardless of actual operating conditions, route severity, load profiles, or environmental exposure. Usage-based maintenance (UBM) powered by IoT sensor data resolves this by triggering maintenance actions based on what each asset has actually experienced, not what the calendar assumes. Rail operators implementing IoT-driven UBM achieve 25-40% reductions in unplanned failures while extending component life by 20-35%, because every maintenance decision is driven by measured reality rather than conservative estimates. Operators ready to transition from calendar guesswork to data-driven precision can start their free trial today.
What if every maintenance decision was triggered by what the asset actually experienced — not what the calendar assumes?
While other operators replace bearings at fixed intervals regardless of load or route, forward-thinking railways use real-time IoT data to maintain each asset based on its actual duty cycle. Discover why leading rail operators trust Oxmaint to turn sensor data into precision maintenance schedules.
Why Calendar-Based Schedules Fail Railway Assets
Railway assets operate under wildly variable conditions that calendar and fixed-mileage schedules cannot account for. A locomotive running 500 miles of flat, tangent track at constant speed experiences fundamentally different stress than one running 500 miles of mountainous curves with frequent braking, gradient changes, and heavy tonnage. Yet traditional maintenance treats both identically — same inspection interval, same component replacement cycle, same depot booking.
The result is a dual failure mode: critical assets operating in severe conditions deteriorate past safe thresholds between scheduled inspections, while assets operating in mild conditions receive unnecessary interventions that waste parts, labour, and availability. IoT-driven usage-based maintenance eliminates both failure modes by measuring actual operating parameters — vibration, temperature, load cycles, braking events, and environmental exposure — and triggering maintenance only when measured degradation warrants action. Rail operations teams seeking to eliminate this waste can see how real-time sensor data replaces calendar assumptions.
Tri-axial accelerometers on wheelsets, traction motors, and gearboxes detect bearing degradation signatures 30-90 days before catastrophic failure — regardless of calendar schedule.
Embedded RTD sensors on brake discs, traction motors, and transformer windings detect abnormal heating patterns that signal insulation breakdown, brake drag, or coolant loss.
Strain gauges and current sensors measure actual tonnage hauled, braking events, traction effort, and gradient stress — building a true fatigue profile for each individual asset.
Humidity, salinity, and particulate sensors track corrosion-accelerating conditions — triggering early protective maintenance for coastal, tunnel, and high-humidity route segments.
IoT Sensor Architecture for Railway Usage Tracking
Effective usage-based maintenance requires an IoT sensor architecture designed for the railway environment — extreme vibration, temperature swings from -30°C to +60°C, electromagnetic interference from traction power, and connectivity gaps through tunnels and rural corridors. Off-the-shelf industrial sensors fail within months on rolling stock. Railway-grade IoT requires ruggedised hardware, purpose-built wireless protocols, and edge computing that processes data locally before transmission.
The architecture spans three tiers: on-asset sensors measuring physical parameters, trackside gateways aggregating and forwarding data, and edge/cloud processing that converts raw measurements into maintenance-triggering intelligence. Each tier must be designed for railway-specific constraints. Engineering teams planning IoT deployment can discuss sensor architecture design with railway IoT specialists.
Railway IoT Sensor Deployment Architecture
| Sensor Type | Railway Asset | Usage Parameter | Threshold Trigger | Failure Lead Time |
|---|---|---|---|---|
| Tri-Axial Accelerometer | Wheelset bearings | Vibration amplitude & frequency | ISO 20816 velocity > 4.5 mm/s | 30-90 days |
| RTD Temperature Probe | Traction motor windings | Winding temperature rise rate | ΔT > 15°C above baseline | 14-45 days |
| Current Transformer | Auxiliary power units | Current draw vs. load profile | > 12% deviation from model | 30-60 days |
| Strain Gauge | Bogie frames, couplers | Cumulative fatigue cycles | > 80% of design fatigue life | 60-180 days |
| Humidity / Corrosion | Underframe, connectors | Corrosion rate (µm/year) | > 25 µm/year sustained | 90-365 days |
| Pressure Transducer | Brake system, pneumatics | Pressure decay rate | > 0.3 bar/min leakage | 7-30 days |
LoRaWAN & Wireless Protocols for Railway Environments
Wireless connectivity on rolling stock and across rail infrastructure presents challenges that standard industrial IoT protocols cannot handle. Metal vehicle bodies create Faraday cage effects, traction power systems generate electromagnetic interference across wide frequency bands, and trains transit between open-air coverage and complete tunnel blackouts dozens of times per journey. Protocol selection determines whether sensor data arrives reliably or vanishes.
LoRaWAN has emerged as the dominant protocol for low-power, long-range railway IoT because it penetrates metal structures, operates on unlicensed spectrum unaffected by traction EMI, and supports 5-10 year battery life — eliminating the depot access required for battery swaps. High-bandwidth sensors requiring waveform capture use BLE mesh or Wi-Fi 6 on-train networks with edge gateway aggregation. Operators evaluating protocol options can discuss wireless architecture with railway connectivity specialists.
Long-range, low-power protocol ideal for scalar sensor data (temperature, pressure, humidity, vibration RMS). Penetrates metal structures, operates licence-free, and supports massive sensor density per gateway.
- Range: 2-15 km open / 500m in-vehicle
- Battery life: 5-10 years
- Data rate: 0.3-50 kbps
- Best for: 70% of railway sensors
Short-range mesh network connecting dense sensor clusters within a single vehicle to the on-train edge gateway. Self-healing mesh topology handles node failures without data loss.
- Range: 30-100m (mesh extends)
- Battery life: 2-5 years
- Data rate: Up to 2 Mbps
- Best for: Dense bogie sensor clusters
Train-to-ground communication carrying aggregated, edge-processed data from on-train gateways to cloud/CMMS. Handles high-bandwidth waveform uploads when in coverage.
- Range: Carrier-dependent (km scale)
- Power: External (train power)
- Data rate: LTE-M 1Mbps / 5G 10Gbps
- Best for: Backhaul & waveform upload
Fixed infrastructure gateways at stations, depots, and lineside cabinets collecting data from passing trains and fixed rail assets (points, signals, track circuits) for wayside monitoring integration.
- Coverage: 2-5 km radius per gateway
- Power: Solar / mains
- Capacity: 10,000+ sensors per gateway
- Best for: Fixed infrastructure assets
Railway Connectivity Performance Benchmarks
Condition Thresholds & Alert Intelligence
Raw sensor data is noise until it passes through a threshold engine that distinguishes genuine degradation from normal operational variation. Railway assets generate enormous data volumes — a single locomotive fleet of 50 units with 60 sensors each produces 3,000 continuous data streams. Without intelligent threshold logic, maintenance teams drown in false alerts and learn to ignore them — the exact opposite of the intended outcome.
Effective threshold configuration operates at three levels: static limits based on OEM specifications and safety standards, dynamic baselines that adapt to seasonal and operational variation, and AI-driven anomaly detection that identifies degradation patterns invisible to fixed rules. Operators configuring threshold systems can explore multi-tier alert configuration with maintenance intelligence specialists.
Multi-Tier Alert & Threshold Architecture
| Asset Component | Monitored Parameter | Tier 2 (Caution) | Tier 3 (Action) | Tier 4 (Critical) |
|---|---|---|---|---|
| Wheelset Bearing | Vibration velocity (mm/s) | > 2.8 mm/s sustained | > 4.5 mm/s trending | > 7.1 mm/s (ISO alarm) |
| Traction Motor | Winding temperature (°C) | ΔT > 10°C above baseline | ΔT > 15°C sustained | > 180°C absolute |
| Brake System | Pressure decay (bar/min) | > 0.15 bar/min | > 0.3 bar/min | > 0.5 bar/min |
| Gearbox | Oil temperature + vibration | Oil > 85°C or vib > 3.0 | Oil > 95°C or vib > 5.0 | Oil > 110°C or vib > 7.0 |
| Pantograph | Contact force variation (N) | Std dev > 20N | Std dev > 35N | Loss of contact > 2s |
Real-Time Anomaly Detection: Edge AI on Rolling Stock
Real-time anomaly detection on rolling stock requires edge computing that processes sensor data locally on the train — because cloud round-trips through cellular networks introduce latency, cost, and failure points. Edge AI models trained on fleet-wide historical data run inference on the on-train gateway, detecting bearing degradation signatures, thermal anomalies, and pressure decay in under 2 seconds without any network dependency.
The edge layer performs four critical functions: noise filtering that separates operational vibration from degradation signals, pattern matching that identifies known failure signatures, trend analysis that projects remaining useful life, and data compression that reduces backhaul bandwidth by 90%+. Only validated anomalies and compressed trend summaries are transmitted to the cloud CMMS — not raw data streams. Engineering teams designing edge architectures can discuss on-train edge computing requirements with IoT architects.
Edge AI Processing Pipeline — On-Train Architecture
On-train gateway collects streams from 40-80 sensors via LoRaWAN and BLE mesh, normalising timestamps, units, and sampling rates into a unified data model every 100ms-10s.
Separates operational noise (track joints, points crossings, tunnel pressure changes) from genuine degradation signals using route-context models that know the expected signature profile.
Trained ML models classify anomaly type (bearing inner/outer race, electrical insulation, seal leak) and severity score. Models updated monthly from fleet-wide learning.
Projects time-to-failure for each flagged component using degradation curve models calibrated to fleet history. RUL estimate drives work order priority and scheduling window.
Caches all processed alerts and compressed data during tunnel transits and coverage gaps. Auto-syncs with preserved timestamps when connectivity restores — zero data loss guaranteed.
Validated anomalies with classification, severity, RUL, and sensor evidence package are pushed to Oxmaint via API — auto-generating prioritised work orders with depot scheduling context.
Every hour a degrading bearing stays undetected is another hour closer to a £320,000 line blockage. Edge AI catches it in 2 seconds.
Stop waiting for calendar dates to trigger inspections. Oxmaint's IoT pipeline converts real-time sensor anomalies into prioritised, dispatched, and verified maintenance actions — automatically. See the complete sensor-to-work-order pipeline in action.
CMMS Integration: From Sensor Anomaly to Verified Repair
The CMMS pipeline is where IoT sensor data either prevents failures or becomes an ignored dashboard. Without direct, automated integration between edge-processed anomalies and maintenance work orders, sensor intelligence sits in a monitoring screen that depot staff never check because they're busy executing the same calendar-based schedule they've always followed. The CMMS must ingest anomalies, score priority, generate work orders, dispatch mobile crews, and verify repair effectiveness through post-maintenance sensor confirmation.
Oxmaint's railway CMMS pipeline operates as a closed loop: sensor detects anomaly → edge classifies severity → API pushes to CMMS → priority scoring against fleet availability and depot capacity → work order generated with sensor evidence and recommended action → mobile dispatch to depot team → repair execution with digital checklist → post-repair sensor verification confirms fix → work order auto-closes only when sensor data returns to baseline. Every step is documented, timestamped, and audit-ready. Operators building this pipeline can watch the closed-loop workflow in a live demonstration.
ROI: Calendar Maintenance vs. Usage-Based Maintenance
The financial case for usage-based maintenance is built on two simultaneous savings streams: eliminating unnecessary interventions on healthy components (over-maintenance waste) and preventing catastrophic failures on overworked components (under-maintenance cost). Calendar schedules optimise for neither — they represent an expensive middle ground where operators waste money on both sides.
The comparison below quantifies the impact for a typical fleet of 50 locomotives. The numbers reflect documented outcomes from railways that have transitioned from calendar-based to IoT-driven usage-based maintenance schedules. Operators building ROI cases for executive approval can access fleet-specific ROI calculation tools during a consultation.
| Metric | Calendar-Based | Usage-Based (IoT) | Improvement | Annual Savings (50 locos) |
|---|---|---|---|---|
| Unplanned Failures | 18-25 per year | 4-8 per year | 65-75% reduction | £1.2M - £2.8M |
| Component Life Utilisation | 55-70% of design life | 85-95% of design life | 20-35% extension | £800K - £1.5M |
| Depot Visits (Unscheduled) | 120-180 per year | 35-60 per year | 55-70% reduction | £600K - £1.1M |
| Schedule 8 Penalties | £1.5M - £4M per year | £200K - £600K per year | 75-85% reduction | £1.3M - £3.4M |
| Maintenance Labour | Baseline | 15-25% reduction | Fewer unnecessary jobs | £400K - £900K |
Total Usage-Based Maintenance ROI Summary
Railway Asset Coverage Matrix
Usage-based maintenance applies across every railway asset class — from high-value rolling stock through trackside infrastructure to depot equipment. The monitoring strategy varies by asset type based on failure modes, criticality, and accessibility. Rolling stock assets benefit most from on-vehicle IoT because they're in constant motion and subject to variable operating conditions. Fixed infrastructure assets benefit from trackside LoRaWAN networks monitoring parameters that change slowly but with high consequence.
Traction motors, wheelset bearings, gearboxes, brake systems, pantographs, cooling systems, auxiliary power units. Highest sensor density — highest failure cost.
Bogie components, door mechanisms, HVAC systems, brake equipment, suspension, and ride quality accelerometers. Focus on comfort and safety-critical systems.
Wheelset bearings, brake systems, coupler strain, and load monitoring. Low sensor count but massive fleet scale — LoRaWAN enables affordable coverage.
Motor current, throw time, locking force, rail temperature, and point detection circuit health. Usage = number of operations, not calendar days.
Relay health, lamp current, track circuit voltage, and battery condition. Critical safety infrastructure where failure has catastrophic consequences.
Rail wear sensors, fishplate stress, bridge strain gauges, embankment tilt monitors, and drainage flow sensors. Long-life LoRaWAN sensors for remote assets.
Performance KPIs for Usage-Based Maintenance Programmes
Measuring the effectiveness of a UBM programme requires KPIs that track both maintenance outcomes and IoT system health. Programme managers need visibility into whether sensor data is actually preventing failures and whether the IoT infrastructure itself is performing reliably. Dashboard design matters — depot managers need asset health views while fleet directors need trend and ROI dashboards.
Number of in-service failures causing delay or cancellation. The primary outcome metric — if this isn't dropping, the programme isn't working.
Average percentage of design life utilised before replacement vs. calendar schedule. Directly measures parts cost savings.
Percentage of confirmed anomalies that generate CMMS work orders. Below 100% means the pipeline has gaps — anomalies are being detected but not actioned.
Percentage of deployed sensors reporting data on schedule. Measures IoT infrastructure health — dead sensors create blind spots in the UBM programme.
Percentage of generated work orders where depot inspection finds no defect. High false positives erode crew trust and depot productivity.
Delay-attribution penalty savings from prevented in-service failures. The metric that makes the financial case to the board.
Conclusion
Usage-based maintenance powered by IoT sensor data represents the fundamental shift from "maintain when the calendar says" to "maintain when the asset needs it." Railways implementing this approach achieve the dual benefit of extending component life on assets operating in mild conditions while intervening earlier on assets operating in severe conditions — eliminating both over-maintenance waste and under-maintenance risk simultaneously.
The technology stack is proven: ruggedised sensors matched to railway failure modes, LoRaWAN networks designed for rolling stock environments, edge AI that processes data locally in under 2 seconds, and CMMS pipelines that convert every validated anomaly into a prioritised, dispatched, and verified maintenance action. The operators achieving 25-40% reductions in unplanned failures and 5-12x ROI multiples aren't using exotic technology — they're using proven IoT architecture integrated with disciplined maintenance execution.
Imagine presenting your next board report showing £4M+ in documented savings from prevented failures and extended component life — what would that do for your maintenance programme's credibility?
Every week without usage-based maintenance is another week accumulating preventable failures and wasting parts budget on components that still had years of life. Join the forward-thinking rail operators that transformed maintenance from calendar guesswork to IoT-driven precision with Oxmaint's connected platform.