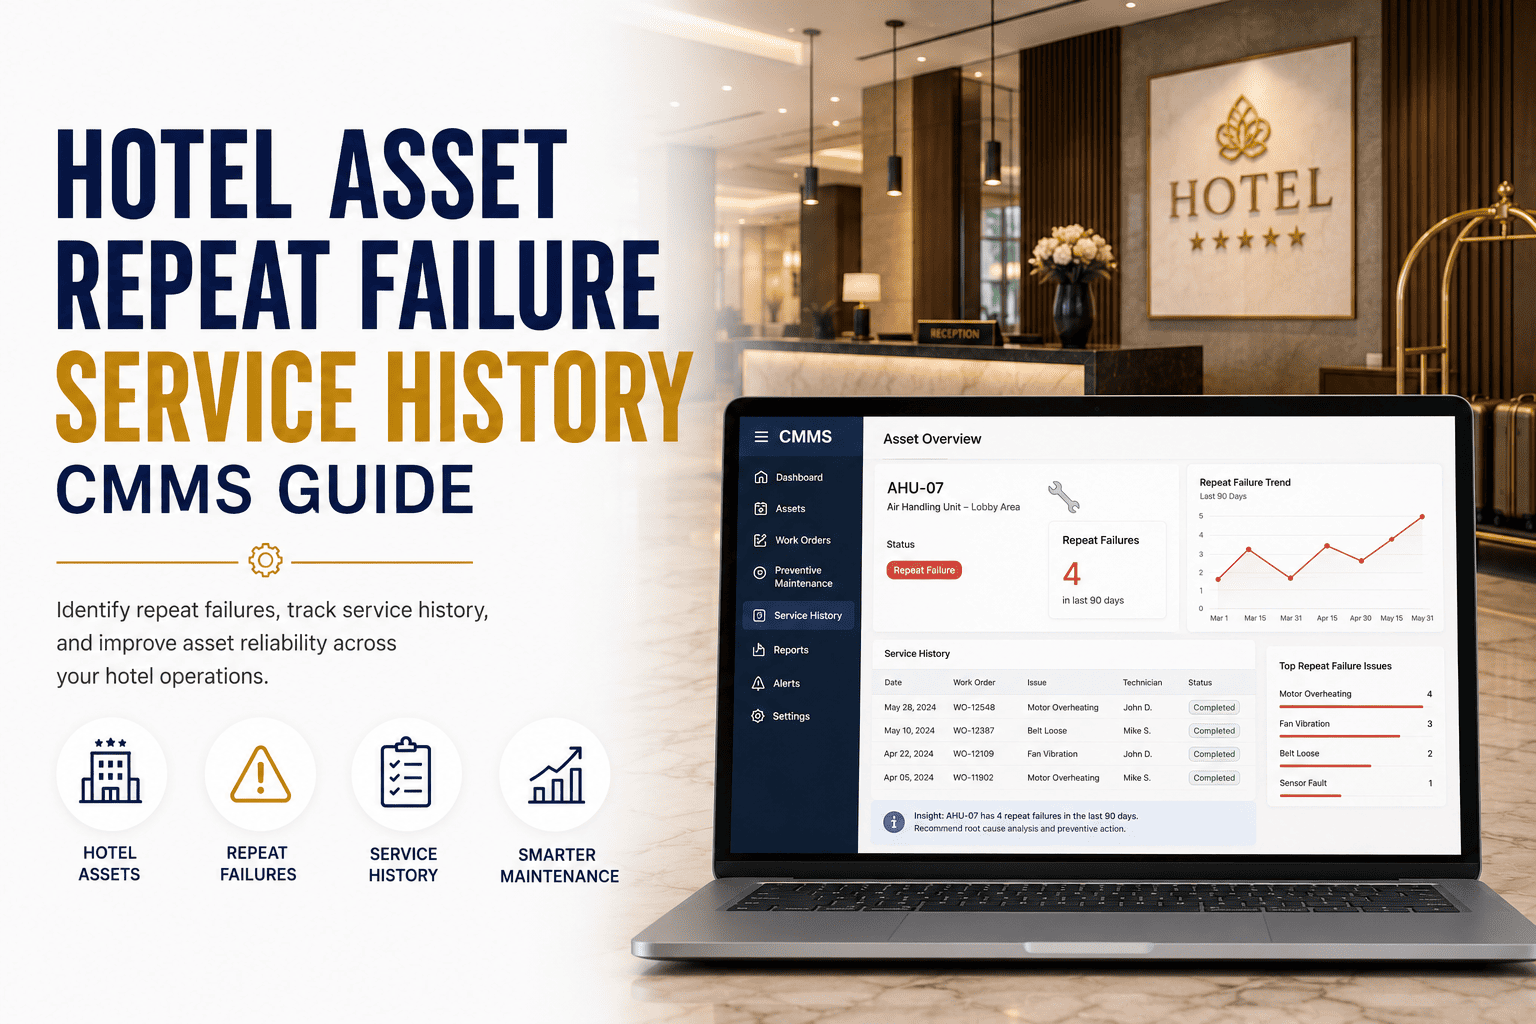
The same guest-room complaint logged three times in a quarter is rarely a coincidence — it is the loudest signal an asset has crossed from random failure into repeat-failure territory, and every untracked recurrence quietly erodes RevPAR, review scores, and engineering labor. For hotels operating 1,200–4,000 individual assets across HVAC, plumbing, laundry, and in-room systems, a CMMS that captures a complete service history is the difference between replacing a $480 PTAC unit at month 14 and bleeding $1,900 in cumulative repairs over 36 months. This guide walks through repeat-failure detection, service-history analytics, root-cause workflows, and the exact CMMS reports that turn recurring complaints into permanent fixes. Get a live workspace with your assets pre-loaded — Start Free Trial.
Is one room quietly draining your maintenance budget?
When the same asset fails three times in 90 days, it stops being a repair problem and becomes a capital decision. A CMMS-built service history converts every work order into evidence — cumulative cost, failure interval, downtime hours — so you replace on data, not gut feel.
Why repeat failures stay invisible without service history
Most hotel engineering teams run on a live work-order queue — today's ticket gets closed, and the asset's history scatters across paper logs, vendor invoices, and a chief engineer's memory. The pattern only surfaces when someone audits.
A 220-key full-service property typically carries 130–170 chronic-repeat assets. At an average $2,180 annual bleed each, that is $280K–$370K in unrecognized replacement candidates sitting on the P&L every year.
The three signals a CMMS should flag automatically
ISO 55000-aligned asset management treats repeat failure as a leading indicator, not a lagging one. Your CMMS should surface three tripwires without manual report-building.
Any asset that logs three or more corrective work orders for the same failure mode inside a rolling 90-day window is auto-tagged as a repeat-failure candidate. The CMMS pushes it to the chief engineer's weekly review queue — no dashboard hunting required.
When MTBF compresses by more than 35% across three consecutive events — say, 42 days down to 27, then 18 — the asset is in terminal decline. The CMMS plots the interval curve on the asset's history page so the trend is visible at a glance.
Once cumulative repair spend (labor + parts + vendor calls + comp nights) reaches 60% of replacement cost inside the current fiscal year, the CMMS raises a capital-justification flag with a pre-built report attached — ready to hand to the GM and ownership.
The formula that turns repair logs into replacement evidence
Capital committees approve replacements when the math is unambiguous. A CMMS service history feeds one clean equation that removes opinion from the conversation.
Room 412 PTAC unit — 14-month failure history
A 180-room limited-service hotel logs four compressor-related failures on one PTAC unit across 14 months. Labor totals $640, parts $410, the OEM vendor visit adds $380, and three comp nights at $159 ADR add $477. Cumulative repair cost = $1,907 against a replacement cost of $1,250 installed. The CMMS capital-justification report flags the unit and the asset is swapped at month 15 — cutting 9 future work orders and an estimated $2,400 in year-two bleed.
| Asset scenario | CRC (12-mo) | Replacement cost | CRC ratio | CMMS action |
|---|---|---|---|---|
| PTAC, Room 412 — 4 failures | $1,907 | $1,250 | 152% | Replace now |
| Boiler circulation pump — 3 failures | $2,340 | $3,900 | 60% | Capital review |
| Ice machine, Floor 3 — 2 failures | $880 | $4,200 | 21% | Monitor + PM |
| Laundry dryer #2 — 5 failures | $4,150 | $5,800 | 72% | Replace now |
| Guest-room water heater — 1 failure | $310 | $1,400 | 22% | Monitor + PM |
From recurring complaint to permanent fix in four steps
A repeat-failure ticket that closes without a root-cause code is guaranteed to reopen. The workflow below is the TPM-aligned standard your CMMS should enforce on every chronic-failure asset.
CMMS auto-flags the repeat pattern
The system ties three work orders to the same asset + failure-mode tag inside 90 days and pushes the asset into the repeat-failure review queue. Average detection lag drops from 11 weeks (manual) to 3 days.
Root-cause code is mandatory on close
Engineer selects from a coded taxonomy — install defect, wear-out, design flaw, environmental, operational misuse. The CMMS blocks closure without a code, building a clean dataset for trend analysis.
Repair, redesign, or replace — backed by data
Chief engineer reviews the CRC ratio, failure-interval curve, and root-cause distribution. If 70%+ of failures share the same root cause and CRC exceeds 60%, the decision is replacement, not another band-aid.
30/60/90-day confirmation window
After the fix, the CMMS watches the asset for 90 days. Zero recurrence closes the loop and removes the repeat-failure tag. A single recurrence escalates to the capital-justification report automatically.
What changes when service history becomes structured data
The shift from paper logs and tribal knowledge to a CMMS-tracked service history is not incremental — it restructures how capital decisions are made and how fast chronic issues are killed.
- Repeat failures detected only when a guest escalates to management
- Repair costs spread across vendor invoices, POS, and P-cards — never aggregated
- Replacement decisions defended with anecdotes, not dollar figures
- No root-cause taxonomy; same fix applied six times to the same asset
- Capital requests rejected for lack of evidence, chronic assets persist
- Auto-flag at third failure within 90 days — before the next guest complaint
- Cumulative repair cost calculated in real time across every cost line
- Capital justification report generated in one click, ownership-ready
- Mandatory root-cause codes build a defensible failure-mode dataset
- Replacement timing optimized to month 14–16, not month 36
Stop paying for the same repair three times.
Spin up a CMMS workspace with your asset list, failure codes, and capital-trigger reports configured in under 48 hours.
Hotel asset service history — the questions engineering directors ask most
How many failures before the CMMS flags an asset as a repeat-failure candidate?
The default trigger is three corrective work orders sharing the same failure-mode tag on the same asset inside a rolling 90-day window. Properties can tune this to two failures for critical-path assets like boilers or laundry dryers, or relax it to four for low-impact items. The threshold is configurable per asset class, so a PTAC and a lobby chandelier do not share the same sensitivity. You can review and adjust these rules in your workspace — Start Free Trial to see the configuration screen.
What goes into the cumulative repair cost calculation?
The CRC formula aggregates four cost lines: internal labor at loaded burden rate, parts and consumables, third-party vendor or contractor spend, and guest-impact cost including comp nights and goodwill gestures. Every line is captured automatically from the work order, the purchase order, and the guest-complaint log. The result is a single defensible number that ownership cannot challenge on methodology.
Can the capital-justification report go straight to ownership or the GM?
Yes. The report exports as a branded PDF containing the asset's full failure timeline, CRC-vs-replacement-cost ratio, root-cause distribution chart, and a one-line recommendation. It is built for a non-technical reader — no CMMS login required. Most engineering directors attach it directly to the monthly capital review deck.
How long does it take to migrate existing asset and work-order data into the CMMS?
A typical 180-room property with 2,500 tagged assets and two years of historical work orders is fully migrated in 5–7 business days. The CMMS imports from Excel, most PMS platforms, and common hotel accounting systems. Historical service history is backfilled so repeat-failure detection works from day one, not after a six-month ramp. Book a walkthrough of the migration process at calendly.com/oxmaintapp/30min.
Does the repeat-failure workflow align with ISO 55000 asset management standards?
Yes. The detection threshold, mandatory root-cause coding, and capital-trigger formula map directly to ISO 55000 clauses on asset performance monitoring and lifecycle decision-making. The CMMS also supports TPM-aligned preventive maintenance triggers so that once a root cause is fixed, the asset moves from corrective to a calibrated PM schedule.
Turn recurring complaints into permanent fixes.
Build your repeat-failure detection, service-history analytics, and capital-justification reports in one CMMS — configured for your property.
Free 14-day trial · No credit card required