CMMS Maintenance Reporting Dashboards: Metrics That Matter

Connect with Industry Experts, Share Solutions, and Grow Together!

Join Discussion Forum
maintenance-reporting-cmms-dashboards

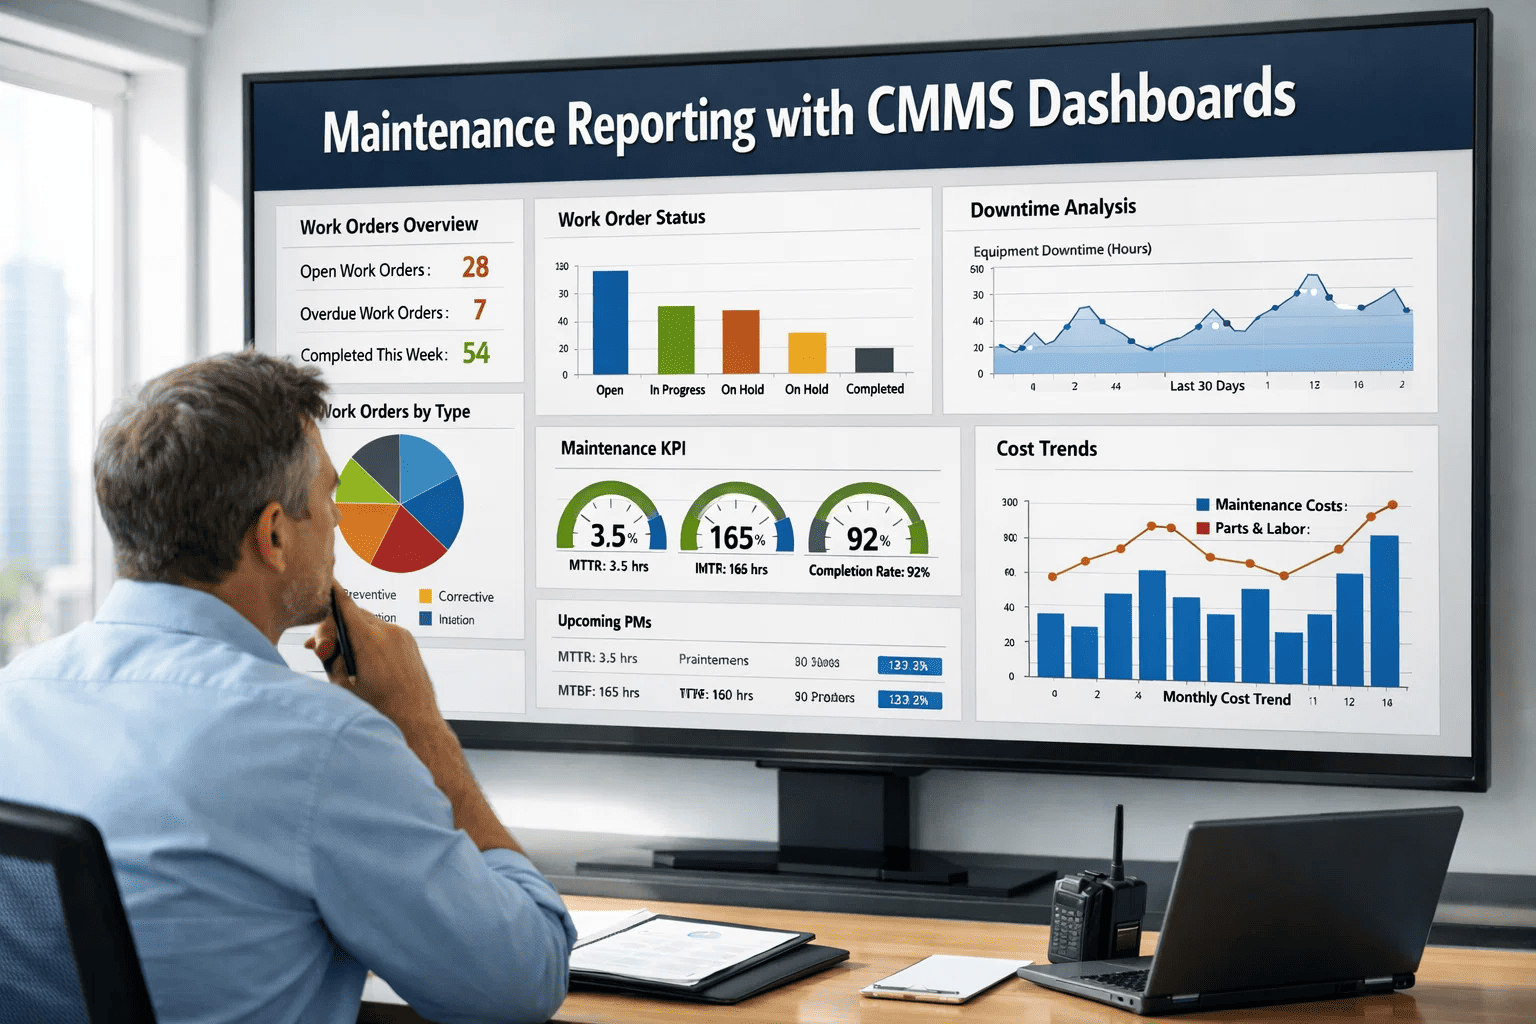
A maintenance dashboard that shows 47 green lights and 3 red ones tells you very little about whether your maintenance program is working. What matters is whether PM compliance is above 90%, whether reactive work orders are trending down month-on-month, whether your highest-cost assets are on schedule, and whether downtime events are concentrated in predictable failure patterns or scattered randomly — the difference between a solvable problem and a structural one. Most CMMS platforms generate data. The question is whether that data is structured into the right metrics, displayed in a way that drives decisions, and accessible to the right people without requiring a data analyst to pull a report. Start a free trial to explore Oxmaint's pre-built maintenance dashboards, or book a demo and walk through the reporting framework with a live data set.

Maintenance Analytics · CMMS Reporting

CMMS Maintenance Reporting Dashboards: Metrics That Matter

How to build maintenance reporting dashboards that drive operational decisions — covering the essential KPIs, the reporting structures that connect maintenance performance to business outcomes, and the CMMS capabilities that make insight accessible without a data team.

67%
Of CMMS users report that their platform generates data they cannot convert into actionable maintenance decisions
3.4x
Faster identification of chronic failure assets when maintenance data is visualised in structured KPI dashboards
91%
Of maintenance managers using live dashboards report improved PM compliance rates versus manual tracking systems
22 min
Average time saved per reporting cycle when dashboards replace manual report assembly from CMMS data exports

The 8 Maintenance KPIs That Actually Drive Decisions

Not all maintenance metrics are decision metrics. A dashboard showing 200 completed work orders tells you volume — it does not tell you whether the right work was done, at the right time, at the right cost, on the right assets. Decision-grade maintenance reporting focuses on metrics that reveal the quality, efficiency, and financial performance of the maintenance program — not just its activity level. Start a free trial to see Oxmaint's pre-built KPI dashboards, or book a demo to review the reporting structure with your team's use case.

01
PM Compliance Rate
Formula: PM work orders completed on time ÷ total PM work orders scheduled × 100
The single most predictive leading indicator of future equipment reliability. Below 85% PM compliance, reactive failure rates rise sharply. Target: 90–95% for critical assets. Dashboard view: weekly trend by asset category and site, with drill-down to overdue PM list.
Industry benchmark: 90%+ for world-class maintenance organisations
02
Planned vs Reactive Ratio
Formula: Planned work order hours ÷ total maintenance hours × 100
Reveals the overall health of the maintenance program. A ratio below 60% planned indicates the team is predominantly reactive — firefighting rather than managing. Trending this metric over 12 months shows whether the maintenance program is improving or degrading in strategic terms.
Industry benchmark: 70–85% planned for mature maintenance programs
03
Mean Time Between Failures (MTBF)
Formula: Total operating time ÷ number of failures for each asset
The reliability metric that measures how long assets run between unplanned failure events. Trending MTBF by asset reveals which equipment is improving, degrading, or in a chronic failure pattern that requires a different maintenance strategy or replacement decision.
Target: MTBF trending upward month-on-month for critical production assets
04
Mean Time to Repair (MTTR)
Formula: Total repair time ÷ number of repair events in the measurement period
Measures maintenance team response and repair efficiency. High MTTR indicates insufficient parts availability, technician skill gaps, or diagnostic difficulty. When combined with MTBF, MTTR drives availability calculation: Availability = MTBF ÷ (MTBF + MTTR).
Target: MTTR below 4 hours for critical production assets in manufacturing
05
Maintenance Cost per Asset
Formula: Total maintenance spend (labour + parts + contractor) ÷ asset count by category
Identifies which assets are consuming disproportionate maintenance resources. An asset spending 4x the category average on maintenance in a rolling 12-month period is a replacement candidate, not a maintenance optimisation problem. This metric drives CapEx decisions with evidence.
Alert threshold: Asset exceeding 2x category average for 3+ consecutive months
06
Work Order Backlog
Formula: Open work orders by age bucket — 0–7 days, 8–30 days, 30+ days, by priority
Backlog analysis reveals capacity constraints, scheduling bottlenecks, and priority misalignment. A growing 30+ day bucket indicates systemic under-resourcing. High-priority items aging beyond 7 days indicate dispatch or parts failures that need immediate management intervention.
Target: Zero P1 work orders older than 24 hours, zero P2 older than 72 hours
07
Unplanned Downtime Hours
Formula: Total hours of unplanned production stoppage caused by equipment failure by period
The maintenance metric with the most direct link to financial performance. Tracked by asset, system, and site — downtime trending reveals whether the maintenance program is preventing production losses or failing to keep pace with deterioration. Connects maintenance KPIs to operations KPIs directly.
Target: Unplanned downtime trending downward — absolute target varies by industry and production margin
08
Overall Equipment Effectiveness (OEE)
Formula: Availability × Performance × Quality — expressed as a percentage of theoretical maximum output
The composite production performance metric that maintenance directly influences through its availability component. OEE below 65% in discrete manufacturing indicates significant improvement opportunity. Maintenance dashboards should show OEE contribution from the availability component — equipment-driven versus operator-driven availability loss.
World-class OEE: 85%+ for discrete manufacturing, 65%+ for batch and process industries

All 8 KPIs Are Pre-Built in Oxmaint — No Report Configuration Required

PM compliance, planned vs reactive ratio, MTBF, MTTR, cost per asset, backlog analysis, downtime hours, and OEE dashboards are available from day one — updated in real time from your work order and asset data.

Dashboard Design Principles: What Separates Useful from Decorative

Dashboard Principle What Poor Dashboards Do What Decision Dashboards Do Why It Matters
Metric Selection Show activity metrics — work orders opened, hours logged, alerts generated Show performance metrics — PM compliance rate, reactive ratio, downtime trend Activity tells you what happened. Performance tells you whether it was the right thing at the right time.
Time Dimension Show current point-in-time status only Show trend over 30, 90, and 365 days alongside current value Trend reveals whether performance is improving or degrading — current status alone cannot show direction
Alert Threshold All metrics displayed as neutral numbers — no performance benchmarks Metrics shown against target thresholds with colour coding for at-risk and critical zones Thresholds transform data into signals — the dashboard tells the viewer where to act, not just what exists
Drill-Down Capability Aggregated totals only — no path to the underlying cause Each aggregate metric drills down to the assets, work orders, or technicians driving it A PM compliance rate of 78% is only useful if it comes with a list of the specific overdue PMs driving the gap
Audience Configuration One dashboard for all users — technician-level detail shown to executives Role-specific views — executive summary, manager operational view, technician task view Executives need trend and cost. Managers need backlog and compliance. Technicians need today's work list. One dashboard serves none of them well.

Reporting by Audience: What Each Role Needs to See

VP Operations / Director of Facilities
Executive Maintenance Summary
Monthly maintenance cost trend by site and portfolio, asset reliability index, planned vs reactive ratio trend, major downtime events with financial impact, and CapEx forecast versus budget. Maximum 6 metrics — each with 12-month trend and variance from target.
Maintenance Manager / Plant Manager
Operational Performance Dashboard
PM compliance rate by asset category, open work order backlog by age and priority, technician workload and completion rate, top 10 assets by reactive maintenance frequency, and MTBF trend for critical assets. Weekly view with daily update frequency.
Maintenance Supervisor / Team Lead
Daily Operations Dashboard
Today's PM schedule and completion status, open reactive work orders by priority and age, technician assignments and current job status, parts requests pending, and work orders completed versus target for the current shift. Real-time — updated continuously from mobile completions.
Asset Manager / Finance
Asset Lifecycle and Cost Dashboard
Maintenance cost per asset and category, cumulative cost-to-replace ratio by asset, condition score distribution across portfolio, CapEx requirement forecast for next 3 years, and assets flagged for replacement review based on cost and condition thresholds.

Reporting Outcomes: What Structured Dashboards Deliver

3.4x
Faster chronic failure identification
MTBF trending dashboards surface repeat failure assets 3.4x faster than reactive review of individual work order histories
91%
PM compliance improvement
Facilities using live compliance dashboards versus manual PM tracking achieve 37 percentage points higher average PM completion
22 min
Saved per reporting cycle
Real-time dashboards eliminate the weekly CMMS export, spreadsheet compilation, and manual report formatting cycle entirely
2.1x
Faster CapEx approval
Asset replacement proposals supported by 12-month cost-per-asset data and condition trend charts receive budget approval more than twice as fast as proposals without supporting maintenance data

Frequently Asked Questions

What is the most important maintenance KPI to start tracking first?
PM compliance rate is the highest-value starting point for most maintenance organisations because it is both a leading indicator of future equipment reliability and a direct measure of whether the planned maintenance program is being executed. A facility with 85%+ PM compliance and a well-designed PM schedule will typically see reactive work orders decline by 25–35% within 6–9 months, without any other change in maintenance strategy. After compliance is established, trending the planned-to-reactive ratio is the next most impactful metric to introduce. Start a free trial and your PM compliance rate will be visible from your first scheduled work order.
How do Oxmaint dashboards update — are they real-time or batch-generated?
Oxmaint dashboards update in real time from work order completion, asset record changes, and sensor data integration. When a technician closes a work order on mobile, the PM compliance rate, backlog count, and technician completion metrics update immediately. There is no overnight batch process, no export-and-refresh cycle, and no delay between field activity and dashboard visibility. For management teams making daily scheduling and resource decisions, real-time dashboard accuracy is the difference between acting on current state and acting on yesterday's picture. Book a demo to see the dashboard update live during the walkthrough.
Can different maintenance roles see different dashboard views in Oxmaint?
Yes — Oxmaint supports role-based dashboard configuration. Users with executive access see portfolio-level summaries — site comparison, cost trends, and reliability indices. Maintenance managers see operational dashboards — PM compliance by team, backlog by priority, and technician performance. Supervisors see the real-time task view — current work in progress, shift completion rate, and pending parts requests. Each role sees the information relevant to their decisions without being overwhelmed by detail configured for a different audience. Dashboard views are set per user role during initial configuration and require no ongoing administration to maintain.
How does maintenance reporting connect to CapEx planning and asset replacement decisions?
Oxmaint's asset-level cost reporting accumulates maintenance spend against each asset across all work orders — labour, parts, and contractor costs. When an asset's cumulative maintenance spend over 24 months approaches its replacement value, the cost-to-maintain-versus-replace decision becomes data-supported rather than intuitive. Combined with condition score trend data showing asset deterioration rate, Oxmaint's CapEx module generates replacement year projections for each asset — producing the 3–5 year capital requirement forecast that finance teams and ownership groups need for budget planning. Start a free trial to begin building your asset cost history today.

Maintenance Data You Cannot Act On Is Just Noise. Build Dashboards That Drive Decisions.

Oxmaint's pre-built maintenance dashboards give every role in your organisation the metrics they need — PM compliance, reactive ratio, downtime trend, cost per asset, and backlog analysis — updated in real time, without a data team or report configuration project.

By Jack Edwards

Experience
Oxmaint's
Power

Take a personalized tour with our product expert to see how OXmaint can help you streamline your maintenance operations and minimize downtime.

Book a Tour

Share This Story, Choose Your Platform!

Connect all your field staff and maintenance teams in real time.

Report, track and coordinate repairs. Awesome for asset, equipment & asset repair management.

Schedule a demo or start your free trial right away.

iphone

Get Oxmaint App
Most Affordable Maintenance Management Software

Download Our App