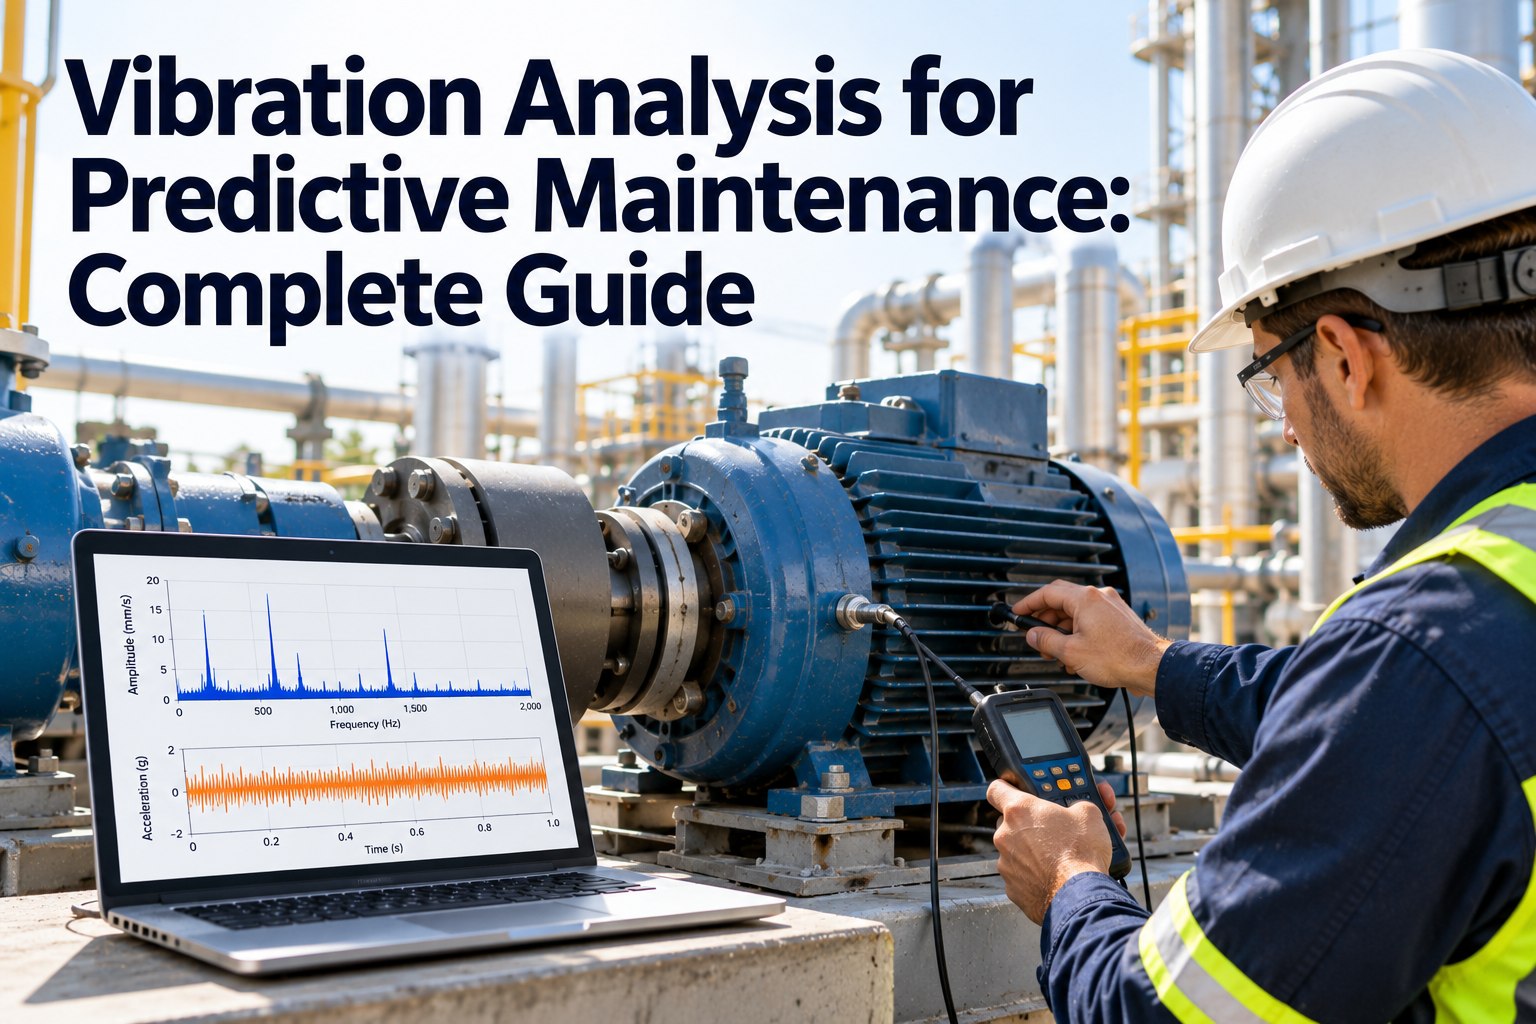
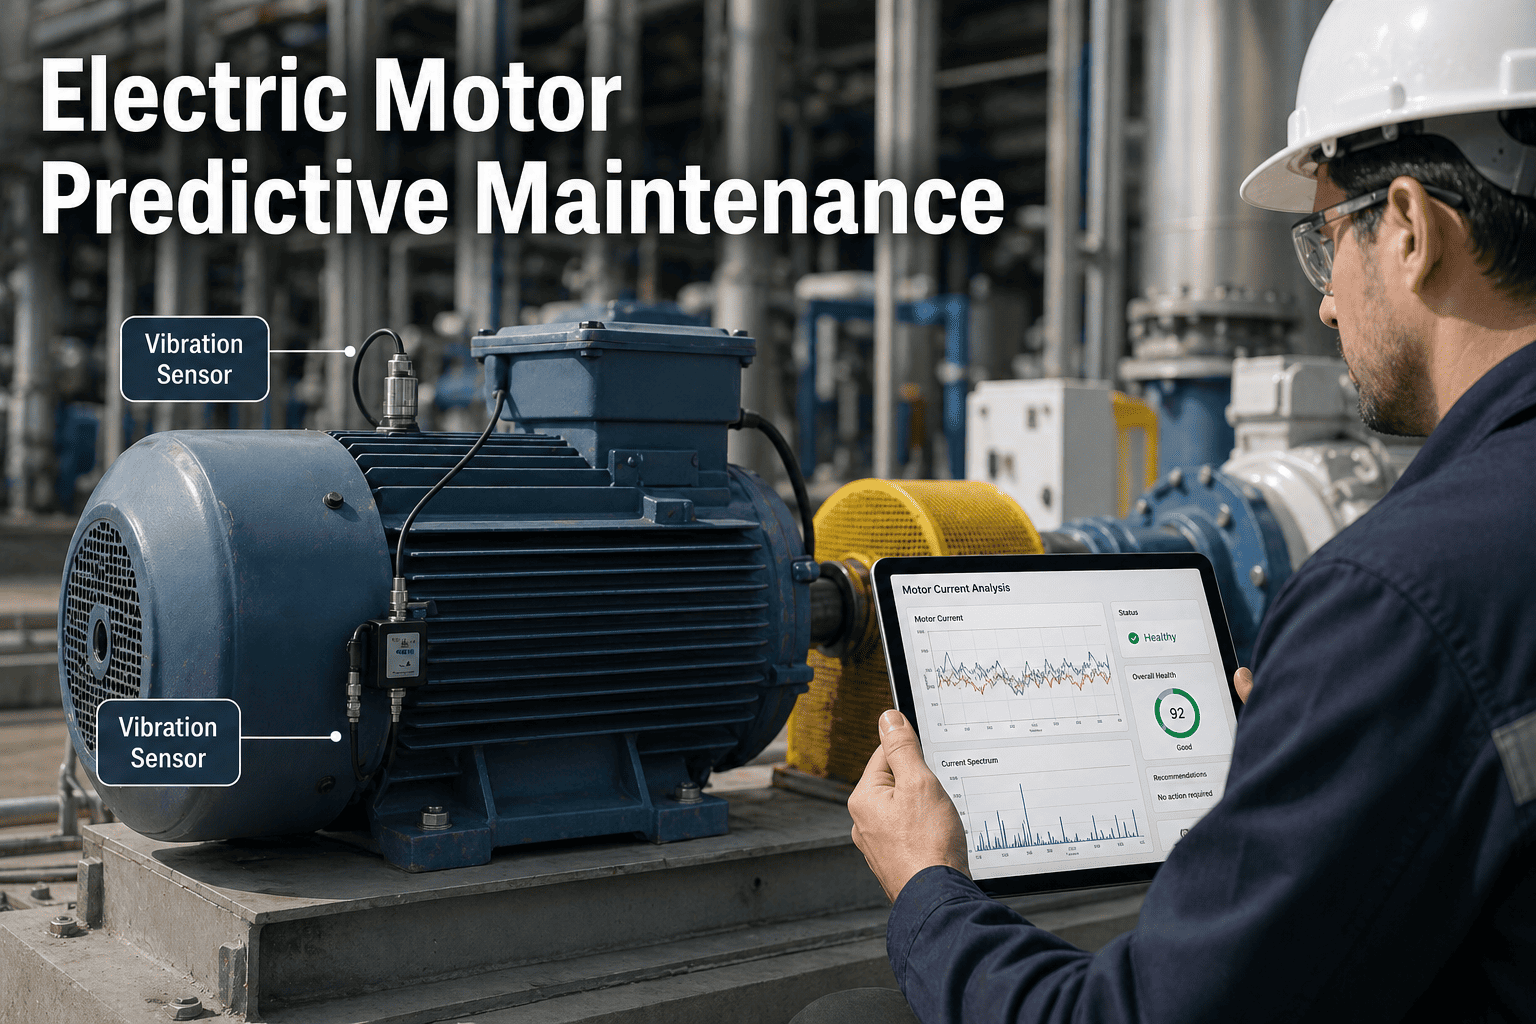
Single-sensor monitoring creates more noise than signal. Vibration spikes from a passing forklift look identical to bearing wear. A thermal anomaly could mean electrical overload or a blocked vent. When you fuse vibration, thermal, and visual data together, you get failure signatures that are specific, early, and actionable — teams using sensor fusion cut unplanned downtime by 35–60%. Start a free trial on Oxmaint to connect your sensors to a CMMS that turns anomalies into work orders automatically, or book a demo and we'll map your highest-risk assets to a fusion monitoring strategy.
Reliability Engineering · 2026
Sensor Fusion for Predictive Maintenance
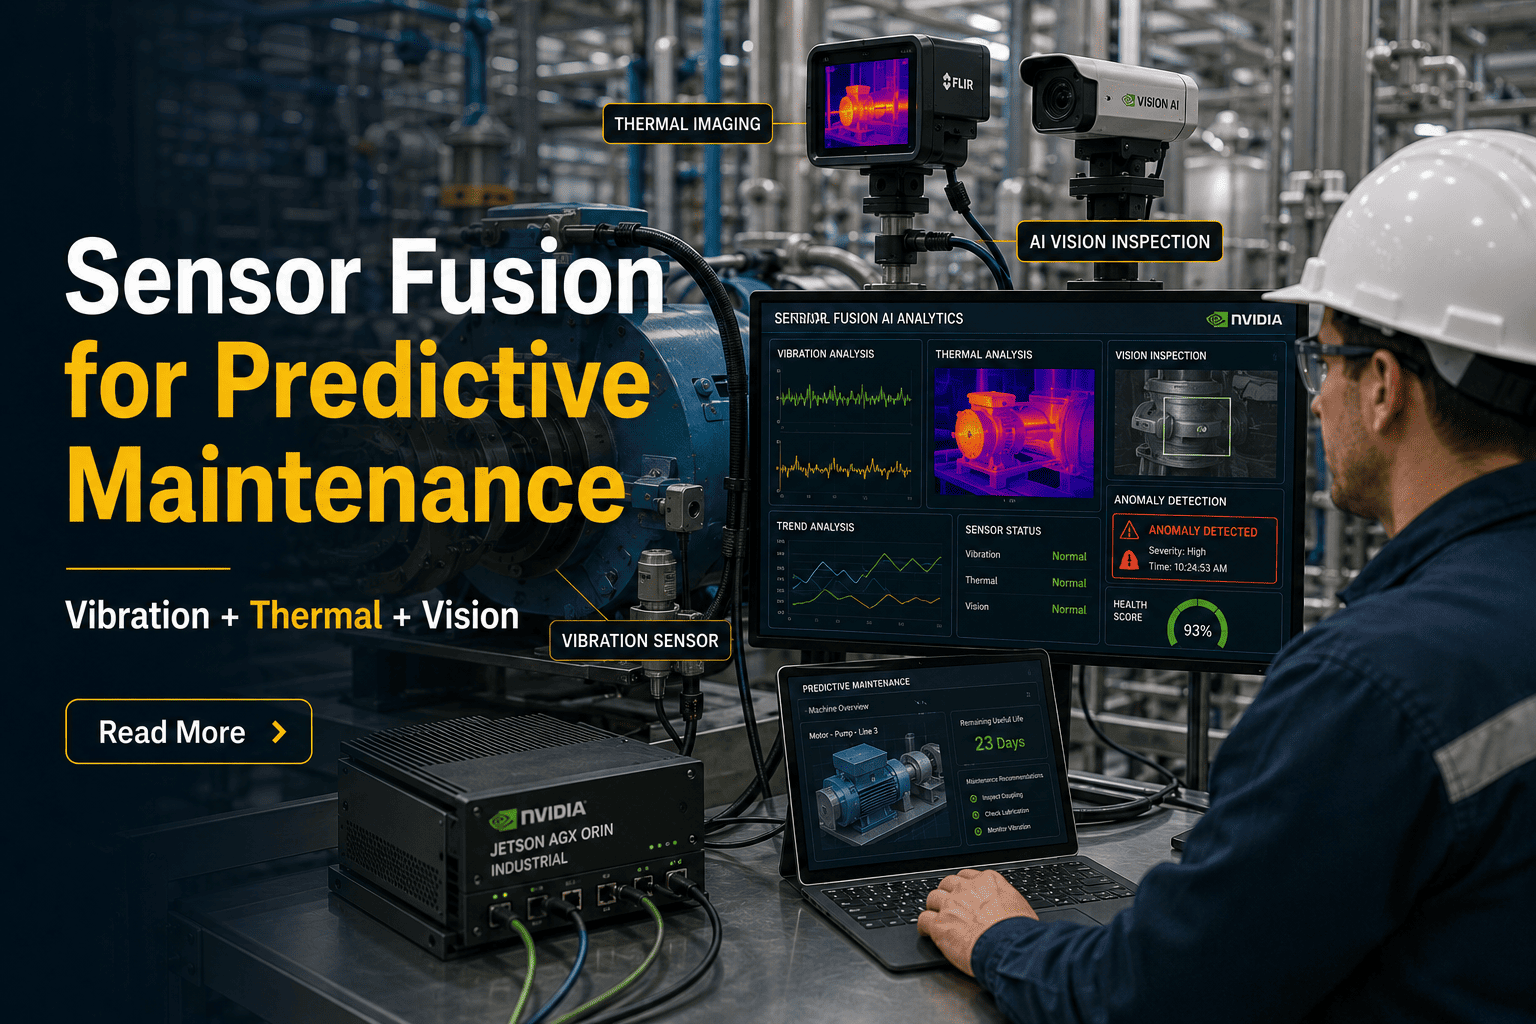
Vibration + Thermal + Vision — three data streams, one failure prediction engine. Here's how it works and what it delivers.
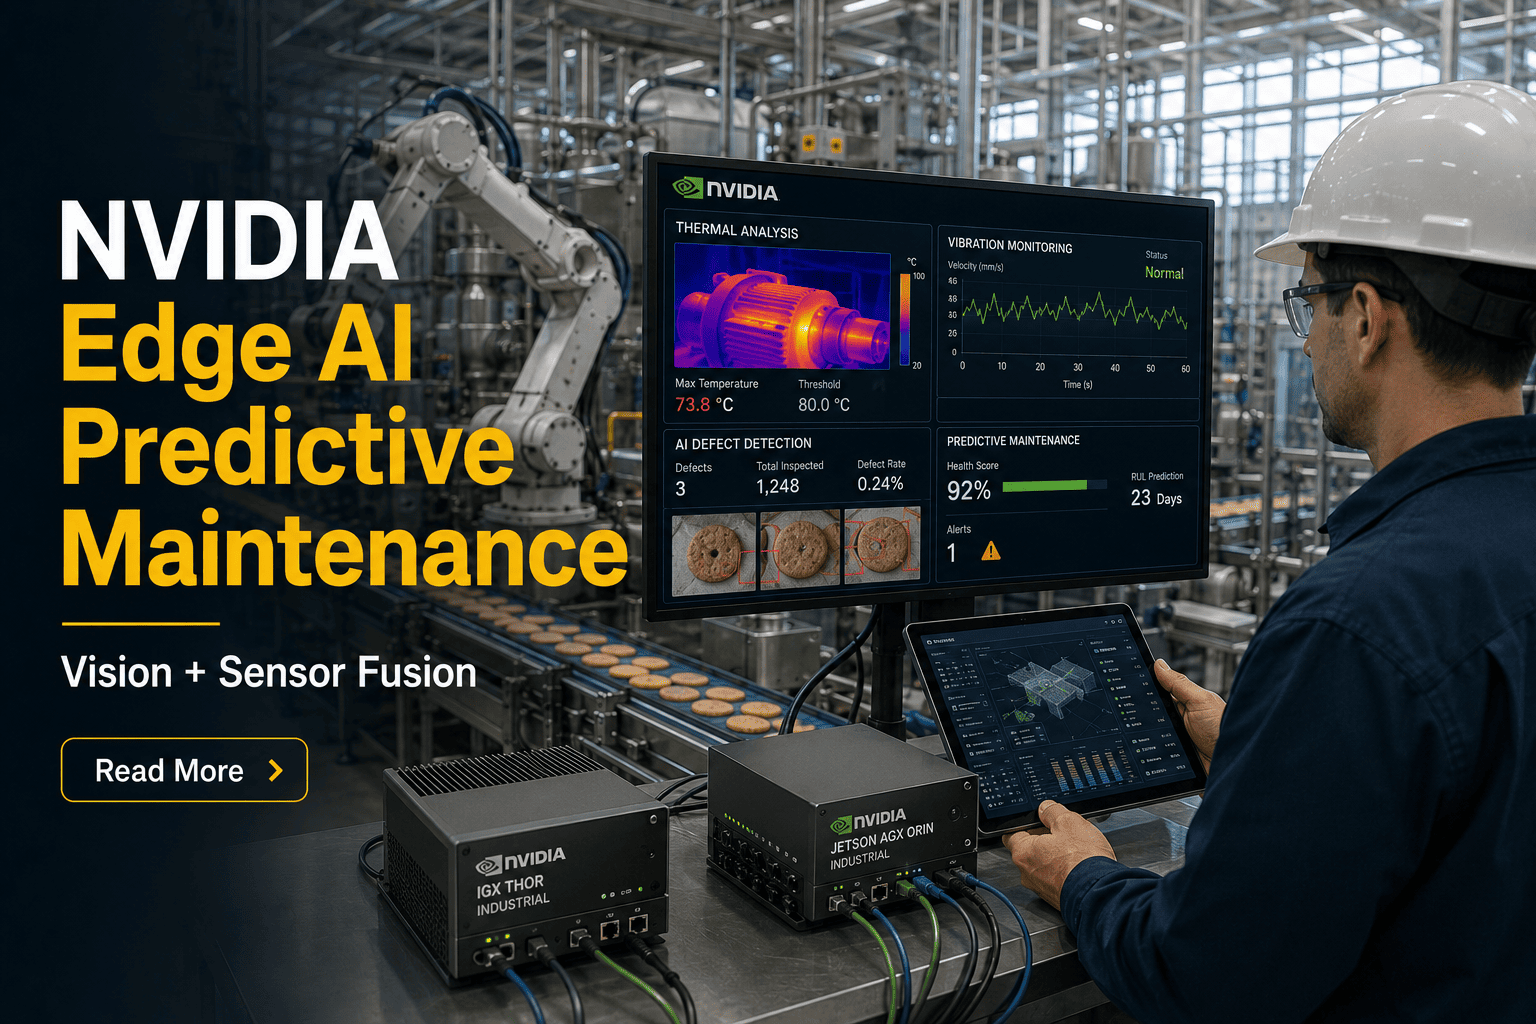
Sensor fusion combines vibration, thermal, and visual signals into a single anomaly model. Instead of a vibration threshold firing false alerts every time load changes, the model cross-checks: is thermal also rising? Does the camera see surface wear? Only when multiple streams agree does an alert fire — cutting false positives from ~40% to under 8% while detecting real failure signatures 2–4 weeks earlier than single-sensor programs.
Winding insulation breakdown, lubrication failure, friction hotspots, blocked cooling. Critical for electrical assets where vibration produces zero signal.
Electrical · Insulation · Lubrication
03
Vision
Surface cracks, corrosion, seal leaks, coupling wear. Provides audit-ready photographic evidence that confirms what vibration and thermal signals suggested.
Cracks · Corrosion · Leaks
04
Acoustic Emission
Active crack propagation, partial discharge, cavitation. Operates at 100kHz–1MHz — often the earliest warning signal, weeks before vibration signatures develop.
Cracks · Discharge · Fatigue
Most facilities lose 20–40% of maintenance budget chasing false alarms from single-sensor monitoring.
The Problem
Why single-sensor programs break down
Vibration misses electrical failures
Motor winding insulation degrades electrically — no vibration signal until it's too late. Thermal imaging catches winding hotspots 2–6 weeks earlier.
Thermal can't localize faults
A hot gearbox could mean bearing overload, lubricant degradation, or gear misalignment. Without vibration frequency data, you can't tell which.
Manual inspection is too infrequent
Quarterly walkthroughs catch failures during rounds — not before them. Continuous vision monitoring closes the gap between inspection intervals entirely.
Siloed alerts create fatigue
Three separate platforms generating uncorrelated alerts = 3–5× more noise than real events. Teams stop trusting alerts — including the critical ones.
Teams switching to multi-modal monitoring see false positive rates drop from 35–40% to under 10% within 90 days — start a free trial to see fused alerts automatically generate prioritized work orders, or book a demo to see what your current program is missing.
How Oxmaint Connects It
From sensor anomaly to work order in minutes
Multi-Modal Condition Scoring
Unified asset health index (1–100) updated every sensor cycle. No manual interpretation.
Automated Work Orders
Anomaly detected → work order created, assigned, and delivered with evidence attached. Zero manual triage.
IoT / SCADA Integration
MQTT, OPC-UA, Modbus TCP, REST. Connects to existing gateways — no hardware replacement required.
5–10 Year CapEx Forecasting
Degradation curves from sensor trends build rolling CapEx models — investor-grade, not gut-feel estimates.
OEE + Reliability Dashboard
Portfolio → asset drill-down in three clicks. From executive KPIs to raw sensor evidence in one platform.
Mobile-First, Multi-Site
Technicians get work orders on mobile with anomaly charts + photos attached. Scales from 1 to 50 sites without reconfiguration.
Before vs After
Reactive monitoring vs sensor fusion
Capability
Reactive / Single-Sensor
Sensor Fusion + Oxmaint
Failure Detection
Hours before — or after
7–30 days in advance
False Positive Rate
35–45%
Under 8%
Electrical Asset Coverage
None
Full thermal + acoustic
Work Order Creation
Manual — after complaint
Automated — from anomaly
CapEx Forecasting
Annual gut estimate
Rolling 5–10yr model
Maintenance Cost Split
60–80% reactive
80%+ planned
Results
What sensor fusion delivers in year one
42%
reduction in unplanned downtime events
8×
ROI vs reactive maintenance programs
28%
maintenance labor cost reduction
3 wks
average advance warning on critical failures
FAQ
Common questions
Which assets benefit most from sensor fusion?
High-criticality rotating equipment above 15kW — motors, pumps, compressors, gearboxes, fans — plus electrical assets like switchgear and transformers where vibration gives no signal. Best ROI comes from assets where a single failure costs more than one year of monitoring investment.
Does Oxmaint require replacing existing sensors?
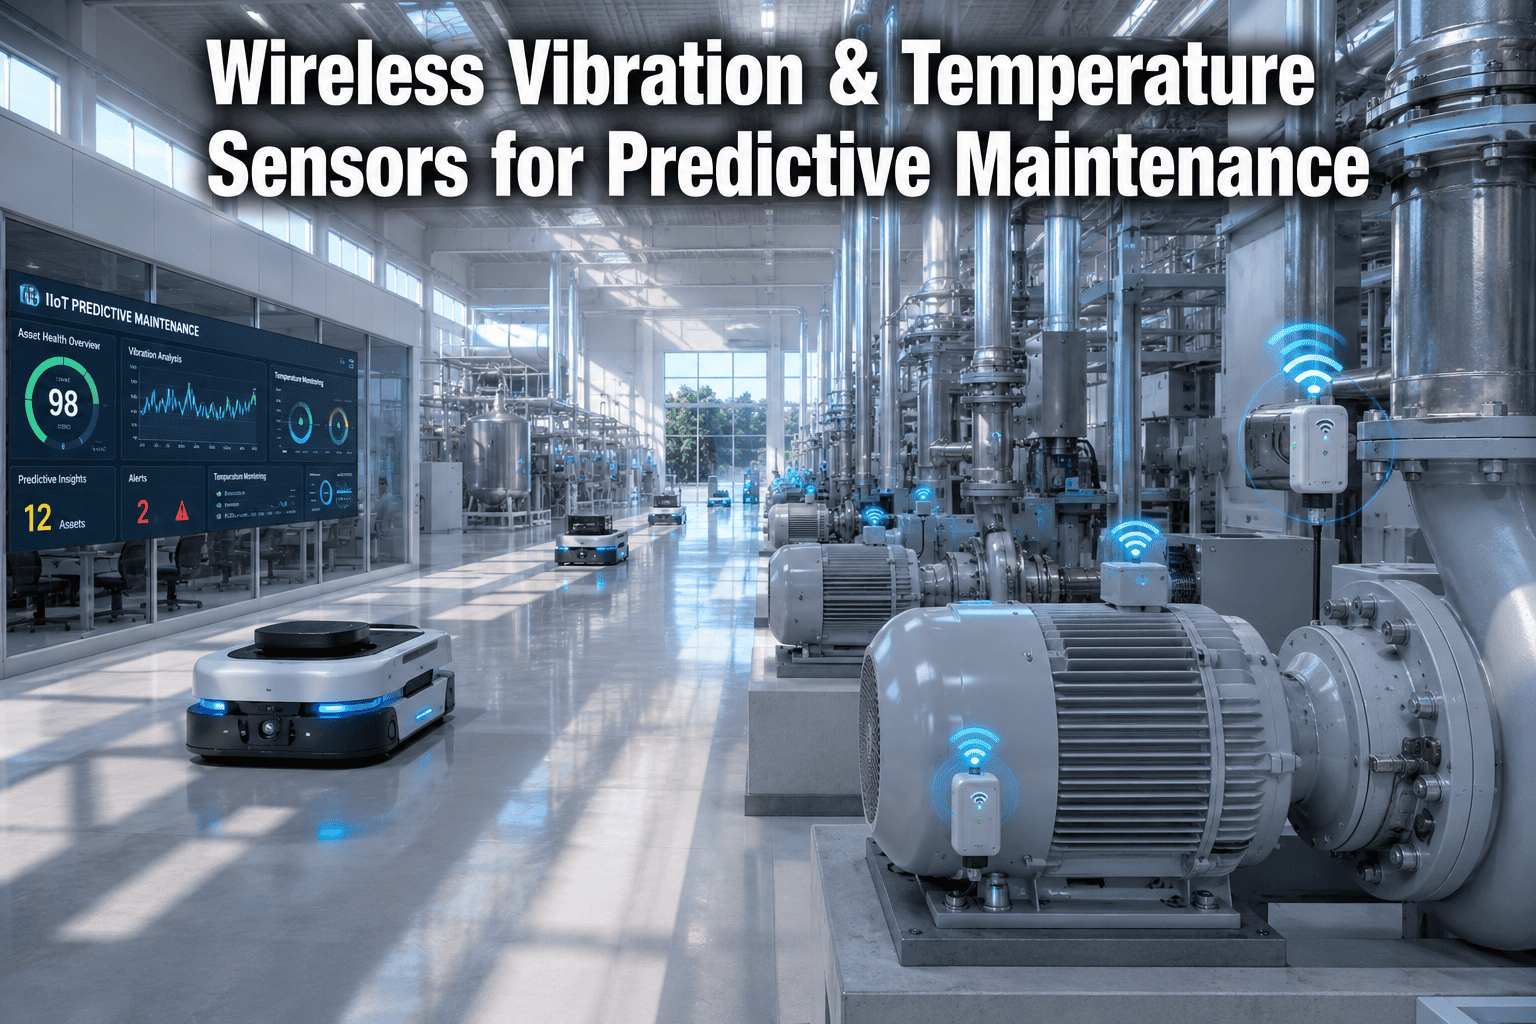
No. Oxmaint connects via MQTT, OPC-UA, and Modbus TCP to sensors already streaming data through your IoT gateway. No rip-and-replace. If you have no sensors installed, wireless vibration and thermal nodes can be mounted without machine downtime and commissioned in under 2 days per asset.
How does Oxmaint convert sensor anomalies into CMMS work orders?
When the fusion model detects a cross-modal anomaly, Oxmaint auto-generates a work order — pre-populated with the anomaly chart, thermal image, failure hypothesis, and recommended action — and assigns it to the right technician. Post-close, the condition score updates automatically, improving model accuracy over time.
How does sensor fusion improve CapEx forecasting?
Degradation curves built from 90+ days of sensor data project each asset's maintenance or replacement window with a confidence range. These feed directly into Oxmaint's 5–10 year rolling CapEx model — giving finance and operations teams data-backed budget justification instead of calendar-based assumptions.
Used by teams managing 10,000+ assets
Stop Losing Millions to Reactive Maintenance
Turn every critical asset into a predictable, trackable system. Real-time condition scoring, automated work orders, and 5–10 year CapEx forecasting — built into your CMMS from day one.
✔ Real-time multi-modal asset visibility✔ Predictive failure alerts with evidence attached✔ Live in days, not months