Portfolio directors managing maintenance across 10, 50, or 500 properties face the same problem at every level of scale: nobody knows, at any given moment, where the backlog is building fastest, which properties are approaching critical failure density, and which assets are sitting at the edge of an expensive emergency repair. The traditional answer is a status meeting, a phone call to each site manager, or a spreadsheet that is already outdated by the time it arrives. A multi-property maintenance backlog heatmap replaces all of that with a live, visual, priority-ranked view of deferred maintenance across every property in the portfolio — updated continuously, not just at reporting intervals. Start a free trial and visualize your portfolio backlog in Oxmaint today or book a demo and see your specific portfolio mapped into the heatmap dashboard.
Visualize deferred maintenance risk by property, asset priority, and service status — and make portfolio-level resource decisions based on data, not status calls.
Used by operations teams managing 10,000+ assets · Live in days, not months · Works across multi-site portfolios
of multi-property operations directors say they lack a real-time view of maintenance backlog risk across their portfolio
4.8×
higher cost of emergency repairs versus backlog items addressed during planned maintenance windows
34%
of deferred maintenance items escalate to emergency status within 90 days when not prioritized with condition scoring
$2.1T
estimated deferred maintenance backlog across US commercial real estate — growing 8% annually due to reactive operations
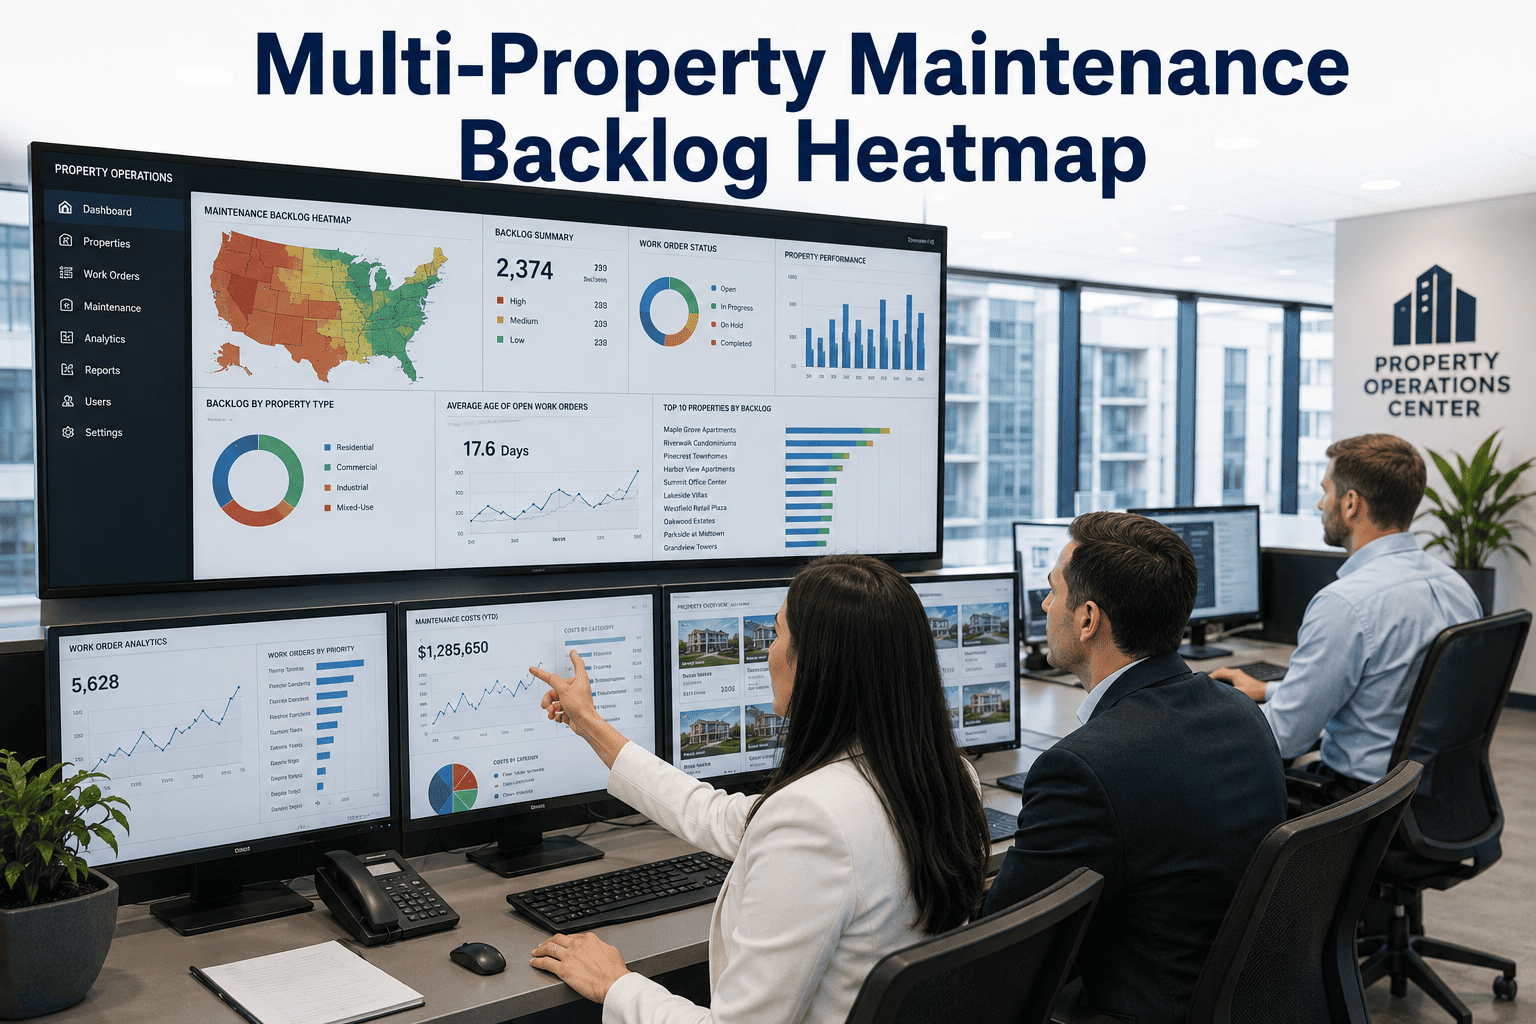
What Is a Maintenance Backlog Heatmap?
A maintenance backlog heatmap is a visual analytics tool that represents the volume, priority, age, and risk level of deferred maintenance items across multiple properties simultaneously. Instead of reviewing individual work order lists property by property, portfolio managers see a color-coded matrix where heat intensity corresponds to backlog severity — properties with high-risk, aging deferred items appear in deep red while well-maintained properties show green or amber, giving leadership an immediate spatial and priority understanding of where resources need to go.
The heatmap draws from live work order data, asset condition scores, PM compliance records, and priority classifications to generate a continuously updated risk picture. Drill-down capability allows directors to move from portfolio view to property level to individual asset — identifying not just which buildings are backlogged but which specific systems and components are driving the risk concentration.
Most facilities lose 20–40% of their maintenance budget to reactive repairs triggered by backlog items that were visible but never prioritized — the heatmap makes invisible risk impossible to ignore.
What a Backlog Heatmap Tracks and Visualizes
01
Backlog Volume by Property
Total open and deferred maintenance items per property displayed as heat intensity. Properties accumulating backlog faster than the team can clear are immediately visible without drilling into individual work order queues.
02
Asset Priority Classification
Backlog items are weighted by asset criticality — life safety, regulatory compliance, revenue generation, and operational continuity. A backlog of minor cosmetic items reads very differently than a backlog of HVAC or electrical system deferrals.
03
Backlog Age and Escalation Risk
Items deferred beyond defined thresholds are flagged with escalating risk indicators. A 30-day deferred item on a non-critical asset reads differently than a 30-day deferred item on a structural system or fire safety component.
04
Service Status and Progress
Work orders in progress, awaiting parts, awaiting contractor, or paused are tracked in the heatmap — so directors see not just backlog volume but backlog velocity. Stalled items are surfaced automatically for management escalation.
05
PM Compliance Overlay
Preventive maintenance compliance rates per property are overlaid on the backlog view — revealing the direct relationship between PM delinquency and reactive backlog accumulation. Properties with low PM compliance consistently show the hottest backlog zones.
06
Cost Concentration Analysis
Estimated repair cost is mapped across the portfolio, identifying which properties represent the highest financial exposure from deferred maintenance — enabling proactive budget reallocation before backlog items become emergency spend.
07
Trend Lines and Backlog Velocity
Week-over-week and month-over-month backlog trends per property show whether properties are improving, holding steady, or deteriorating — so resource allocation decisions are forward-looking, not just reactive to the current snapshot.
08
CapEx Integration and Forecasting
Chronic backlog patterns on specific asset classes feed into rolling 5–10 year CapEx models — translating recurring deferred maintenance into evidence-backed capital replacement requests for finance and investment committees.
The Real Cost of Invisible Portfolio Backlog
Backlog Invisibility Drives Emergency Spend
When portfolio directors don't see backlog building until a site manager calls with a crisis, every deferred item becomes a potential emergency repair billed at 4.8× the cost of a planned intervention. Invisibility is not a reporting problem — it is a budget problem.
Resource Misallocation Across Properties
Without a heatmap, maintenance budgets are allocated by squeaky-wheel dynamics — the loudest site manager gets the resources. Meanwhile, properties with silent but rapidly accumulating structural backlog continue deteriorating undetected until failure is unavoidable.
Compliance and Liability Accumulation
Deferred maintenance on life safety systems, fire suppression, structural elements, and regulatory-mandated equipment creates documented liability exposure that compounds every week the items remain open. Portfolio managers who can't see this risk can't manage it.
CapEx Forecasting Without Evidence
Finance teams reject CapEx requests built on site manager estimates and asset age. Without documented backlog history and condition scoring tied to specific asset systems, capital allocation remains a negotiation — not a data-driven decision.
Reporting Hours With No Operational Value
Portfolio directors and their teams spend 6–12 hours per week compiling maintenance status reports from individual properties — hours that produce a snapshot already outdated before it reaches the boardroom. Manual reporting is not visibility; it is the appearance of visibility.
Tenant and Investor Credibility at Risk
Institutional investors and major commercial tenants expect evidence of proactive asset management — not anecdotes. A portfolio that can't produce backlog data, PM compliance rates, and condition scores by property is a credibility liability in every due diligence conversation.
All properties display as a ranked, color-coded backlog matrix updated in real time from live work order and condition data. Directors see total backlog volume, high-priority concentrations, and cost exposure across the entire portfolio in a single view — no consolidation required.
Asset Priority and Risk Weighting
Backlog items are automatically weighted by asset criticality — life safety, regulatory, revenue, and operational classifications. A high-risk item on a fire suppression system is weighted completely differently from a cosmetic repair on a non-critical component.
Drill-Down From Portfolio to Asset
From the portfolio heatmap, directors drill into any property to see backlog by system — structural, mechanical, electrical, plumbing, fire safety. From there, drill to individual asset work order history, condition score, and upcoming PM schedule.
Automated Escalation and Alerts
Backlog items exceeding defined age or risk thresholds trigger automatic escalation notifications to property managers and portfolio directors. No manual chasing, no status calls — the system surfaces critical items before they become emergency failures.
PM Compliance and Backlog Correlation
Oxmaint surfaces the direct relationship between preventive maintenance delinquency and backlog accumulation per property — giving leadership the evidence needed to resource PM programs adequately and prevent reactive backlog buildup.
Investor-Grade Portfolio Reporting
Exportable portfolio reports include backlog by property, PM compliance rates, asset condition scores, and cost exposure — formatted for investment committee reviews, due diligence requests, and regulatory reporting without additional data gathering effort.
Manual Reporting vs. Live Backlog Heatmap
Reactive: Manual Status Reporting
Planned: Live Backlog Heatmap Analytics
6–12 hours per week compiling status reports from individual sites
Live portfolio view updated continuously — zero manual consolidation
Backlog visibility limited to what site managers choose to report
Complete backlog picture from all work orders regardless of site reporting behavior
Budget allocation based on loudest property manager, not highest risk
Resource allocation driven by condition scores and priority weighting across portfolio
Deferred items escalate silently until they become emergency calls
Automatic escalation alerts at configurable age and risk thresholds
CapEx requests built on site estimates without documented backlog evidence
Rolling 5–10 year CapEx forecasts built from live backlog and condition data
Investor reporting requires weeks of manual data gathering and formatting
Investor-grade portfolio reports exportable on demand in minutes
ROI of Portfolio Backlog Visibility
34%
of deferred backlog items escalate to emergency status within 90 days — heatmap visibility eliminates this escalation cycle
4.8×
cost difference between reactive emergency repairs and planned backlog resolution — captured by early prioritization
8 hr
average weekly time savings for portfolio directors when manual status reporting is replaced by live heatmap analytics
26%
reduction in total maintenance spend when backlog is managed proactively with condition-based priority ranking
How does the Oxmaint maintenance backlog heatmap work technically?
Oxmaint's heatmap analytics engine aggregates data from all open and deferred work orders across every property in the portfolio — continuously. Each work order is classified by asset criticality, estimated cost, age, and current status. The heatmap visualization maps this data into a color-coded property matrix where heat intensity reflects risk concentration — combining volume, criticality, age, and cost exposure into a composite backlog score per property. Directors can configure which factors drive heat weighting to match their specific portfolio priorities — life safety compliance, financial exposure, or operational continuity.
Can the heatmap be filtered by asset type, system category, or priority level?
Yes. Oxmaint's heatmap supports multi-dimensional filtering — by asset system (HVAC, electrical, plumbing, structural, fire safety), by work order priority level, by backlog age, by estimated cost band, and by PM compliance status. Directors can isolate life safety backlog across the entire portfolio in seconds, or view all open items for a specific property's mechanical systems. Custom filter presets can be saved for recurring reporting needs — including investor reporting, compliance audits, and board presentations.
How does Oxmaint handle backlog data for portfolios with hundreds of properties?
Oxmaint's architecture is built for portfolio scale — the platform manages portfolios of 10 to 10,000+ properties in a single account without performance degradation. The heatmap aggregates backlog data across all properties simultaneously, with hierarchical drill-down from portfolio to property to system to individual asset. Regional groupings, property type filters, and asset class categories allow large portfolio teams to segment the heatmap view for different management levels — operations directors see the full portfolio; regional managers see their geography; site managers see their property.
How does backlog heatmap data feed into CapEx forecasting?
Chronic backlog patterns on specific asset classes — persistent deferred maintenance on roof systems, HVAC equipment, or elevator components — feed directly into Oxmaint's rolling CapEx model. The system identifies assets with recurring backlog accumulation and condition score decline, then projects replacement or major overhaul requirements over a 5–10 year horizon. These projections are exportable as capital forecast reports that finance teams and investment committees can use directly — with documented backlog evidence and condition trend data as the supporting basis.
Stop Managing Your Portfolio Blind — See the Backlog Before It Sees You
Live heatmap analytics across every property in your portfolio — updated continuously, prioritized by risk, and ready for investor-grade reporting on demand.
✔ Real-time backlog visibility across every property
✔ Predictive failure alerts before backlog escalates
✔ 5–10 year CapEx forecasting from backlog and condition data
See measurable results in the first 30 days · No heavy implementation required · Works across multi-site portfolios