Cement Industry Decarbonization Roadmap: Technology and Strategy
By Samuel Jones on February 27, 2026
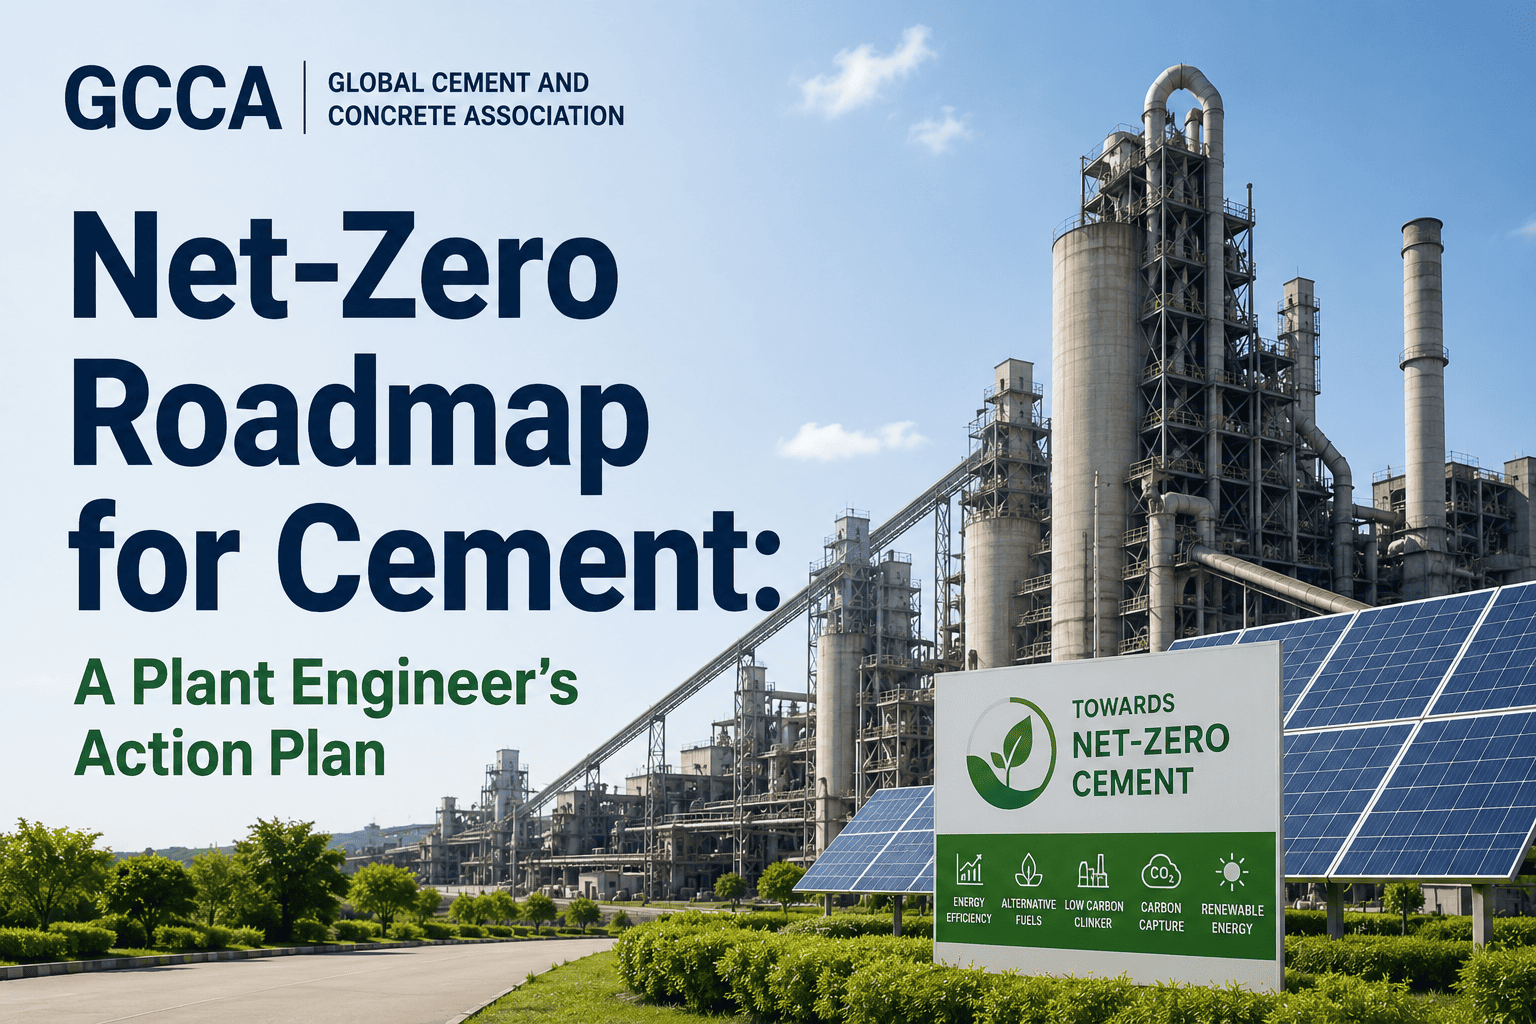
The cement industry must cut its emissions by 75-90% by 2050 to align with Paris Agreement targets. That means reducing from today's ~4.1 billion tonnes of CO₂ annually to under 1 billion — while global cement demand is projected to grow 12-23% over the same period. There is no single technology that solves this. Decarbonization requires a portfolio of levers deployed in parallel: clinker substitution to reduce process emissions, alternative fuels and energy efficiency to cut combustion emissions, renewable electricity to eliminate Scope 2, and carbon capture to address the residual process CO₂ that no other lever can touch. The roadmap is clear. The technologies exist or are in advanced development. What's missing at most cement companies is the operational infrastructure to execute — the ability to track carbon intensity in real time, link decarbonization performance to equipment condition, and manage the new asset types that green cement demands.
The Net-Zero Equation for Cement
TODAY
~620
kg CO₂/t cement (global avg)
2050 TARGET
<100
kg CO₂/t cement (net-zero aligned)
84% reduction required
While demand grows 12-23% by 2050
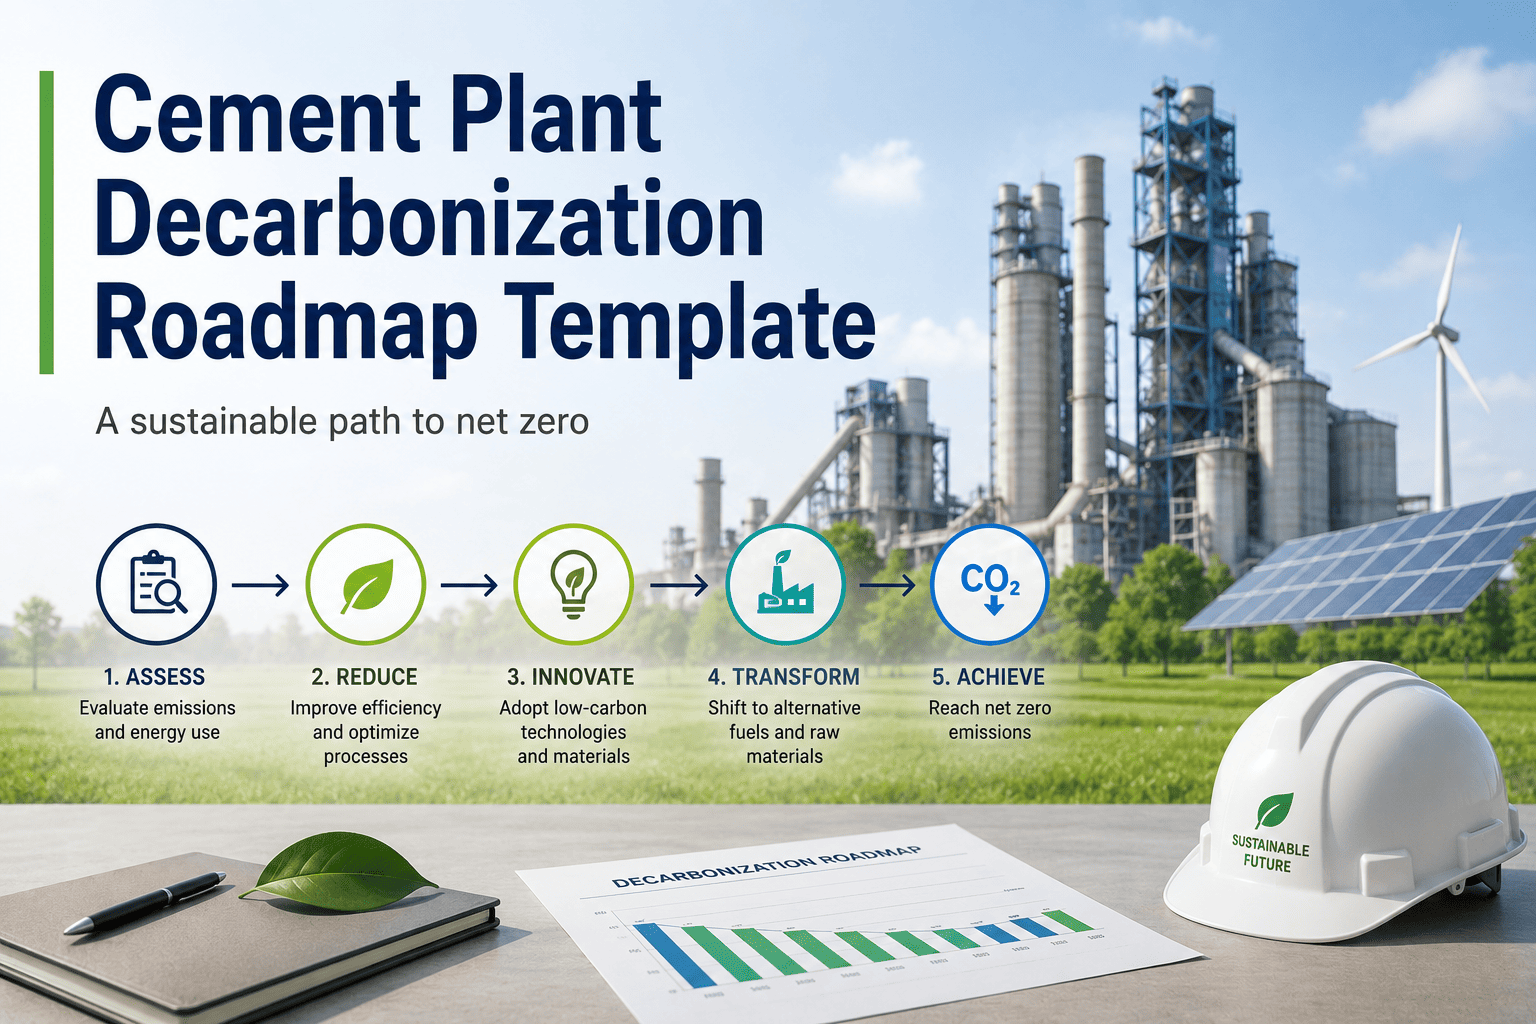
The Five Decarbonization Pillars
Every credible cement decarbonization roadmap — from the IEA, GCCA, or individual company strategies — breaks down into the same five pillars. The difference between companies isn't what they plan, it's how fast and effectively they execute. Each pillar below shows the technology readiness, reduction potential, and implementation requirements.
1
-80 to -130
kg CO₂/t cement
READINESS
TRL 9 — Commercial
Clinker Substitution
Reduce the clinker-to-cement ratio
Since 60% of cement CO₂ comes from clinker production, making cement with less clinker is the fastest, cheapest, and most impactful lever available today. Every percentage point reduction in clinker factor reduces CO₂ by ~8 kg/t cement.
Clinker factor 0.50-0.60. Uses locally available calcined clay + limestone. Up to 40% lower CO₂ than OPC. Rapidly scaling across India, Africa, Latin America.
Ground Granulated Blast Furnace Slag (GGBFS)
Clinker factor as low as 0.35 in PSC. Supply constrained as steel industry evolves — long-term availability uncertain.
Key barrier: Product standards, customer acceptance, and SCM (supplementary cementitious material) supply constraints. LC3 is the breakout technology because clay is globally abundant.
2
-50 to -100
kg CO₂/t cement
READINESS
TRL 7-9 — Demonstrated
Alternative Fuels
Replace fossil fuels with waste and biomass
Replacing coal and petcoke with waste-derived and biomass fuels reduces fossil CO₂ from kiln combustion. Biomass is carbon-neutral; waste-derived fuels partially offset fossil carbon. Leading plants achieve 80%+ thermal substitution rates.
Biomass (agricultural waste, wood, sewage sludge)
Carbon-neutral fuel. 14-18 MJ/kg. Every 10% biomass substitution reduces net CO₂ by ~25 kg/t clinker.
12-20 MJ/kg. Partially biogenic carbon (~40-60%). Requires pre-processing and quality control infrastructure.
Tire-Derived Fuel / Waste Oils
High calorific value (28-38 MJ/kg). Fossil carbon but displaces virgin coal. Feed handling systems required.
Key barrier: AF availability and supply chain logistics. Pre-processing investment. Permit requirements vary by jurisdiction. Maintaining kiln stability with variable fuel quality.
3
-30 to -60
kg CO₂/t cement
READINESS
TRL 9 — Commercial
Energy Efficiency
Reduce thermal and electrical energy per tonne
The gap between industry average (~3,300 MJ/t clinker) and best practice (~2,800 MJ/t) represents billions of dollars in wasted fuel and millions of tonnes of unnecessary CO₂. Energy efficiency improvements have direct carbon benefits AND immediate financial returns.
Combustion & Preheater Optimization
Excess O₂ control, false air sealing, separator efficiency. Quick-win savings of 3-8% fuel with minimal capital.
Waste Heat Recovery (WHR)
ORC or steam Rankine systems recovering 25-35% of plant electrical demand from exhaust and cooler heat.
AI/Advanced Process Control
AI-based kiln optimization delivers 3-7% fuel savings through continuous parameter tuning. ROI typically <2 years.
Key barrier: Requires maintenance excellence — efficiency gains are impossible to sustain without reliable equipment. This is where CMMS integration is critical.
4
-30 to -60
kg CO₂/t cement
READINESS
TRL 7-8 — Scaling
Renewable Electricity & Electrification
Decarbonize Scope 2 and explore electric kilns
Scope 2 emissions (5-10% of total) can be eliminated with renewable power procurement and on-site generation. Longer term, kiln electrification using renewable power could address a portion of Scope 1 thermal emissions.
Renewable PPAs / Green Tariffs
Contract-based procurement of renewable electricity. Can reduce Scope 2 to near-zero at competitive cost in many markets.
On-site Solar / Wind
Cement plants have large land areas. 5-20 MW solar is increasingly common, covering 10-25% of electrical demand.
Electric / Plasma Kiln (Emerging)
Replace fossil fuel combustion with electrical heating. Early-stage R&D (TRL 3-5). Addresses fuel CO₂ but not process CO₂.
Key barrier: Grid connection capacity for large-scale renewable procurement. Electric kiln technology is 10-15 years from commercial readiness.
5
-200 to -350
kg CO₂/t cement
READINESS
TRL 5-7 — Pilot/Demo
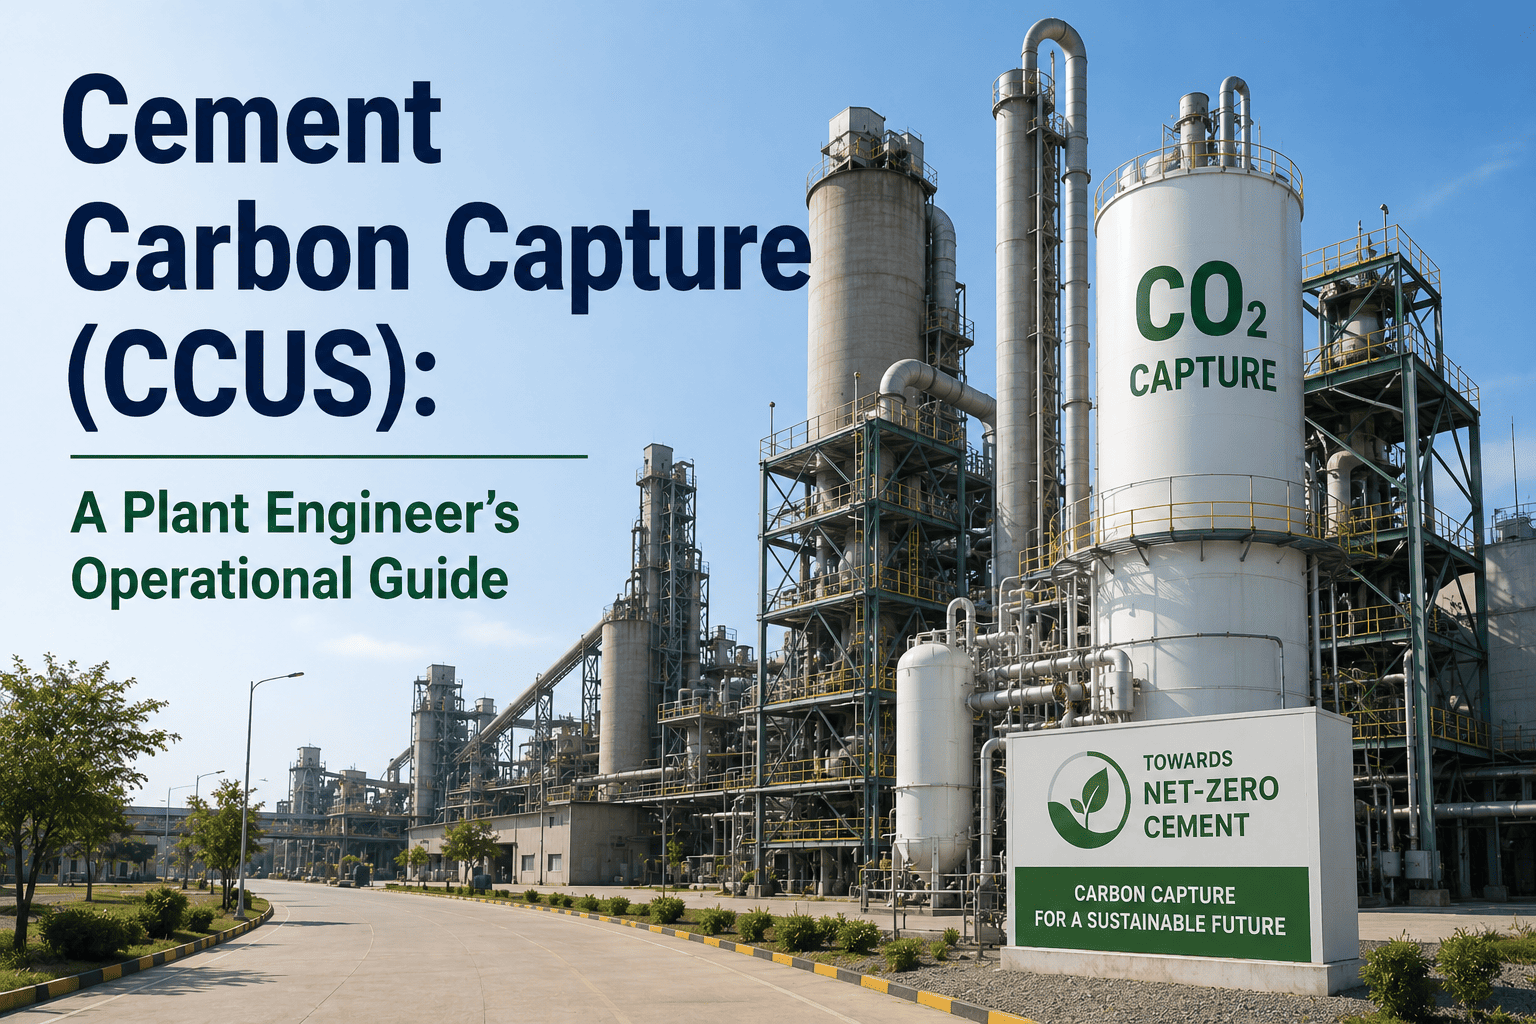
Carbon Capture, Utilization & Storage (CCUS)
Capture the process CO₂ that nothing else can eliminate
The ~525 kg CO₂/t clinker from calcination cannot be reduced by fuel switching, efficiency, or clinker substitution alone. CCUS is the only technology that can address this residual process emission — making it essential for achieving net-zero. It is also the most expensive and least mature lever.
Post-Combustion Capture (Amine Scrubbing)
Most mature CCS technology for cement. 85-95% capture rate. Energy penalty: 2.5-3.5 GJ/t CO₂. Heidelberg Materials' Brevik plant (Norway) targeting 400,000 t CO₂/yr by 2025-2026.
Oxyfuel Combustion
Burns fuel in pure oxygen rather than air, producing a concentrated CO₂ exhaust stream that's easier to capture. LEILAC/Calix technology separates calcination CO₂ directly. Pilot at HeidelbergCement Hannover.
Calcium Looping
Uses limestone (CaO) to absorb CO₂ from flue gas, then regenerates in a separate reactor. Synergy with cement chemistry. TRL 5-6 with several EU-funded pilots.
Carbon Utilization (CCU)
Convert captured CO₂ into products: aggregates (CarbonCure, Solidia), synthetic fuels, chemicals. Smaller scale but avoids storage infrastructure.
Key barrier: Capital cost ($150-400/t CO₂ captured today), energy penalty (increases fuel consumption 30-50%), CO₂ transport and storage infrastructure, and regulatory frameworks for permanent storage.
Decarbonization Starts With Operational Excellence
You can't capture carbon you can't measure. You can't sustain efficiency gains on unreliable equipment. OXmaint provides the maintenance and monitoring foundation that every decarbonization strategy requires.
The Investment Landscape: What Decarbonization Costs
Decarbonization investment ranges from quick-payback operational improvements to billion-dollar capital projects. Understanding the cost-per-tonne-of-CO₂-avoided for each lever is essential for building a financially viable roadmap.
Lever
CAPEX Range
CO₂ Abatement Cost
Payback
Readiness
Energy efficiency
$5-15M
-$20 to -$50/t CO₂
1-3 yrs
NOW
Clinker substitution (PPC/PSC)
$2-8M
-$10 to -$30/t CO₂
1-2 yrs
NOW
LC3 conversion
$15-40M
-$5 to $20/t CO₂
3-5 yrs
NOW
Alternative fuels (30-80% TSR)
$10-50M
$10-40/t CO₂
3-6 yrs
NOW
Waste heat recovery
$15-25M
$20-50/t CO₂
4-6 yrs
NOW
Renewable electricity (PPA/on-site)
$5-30M
$15-60/t CO₂
5-10 yrs
2025-28
Post-combustion CCS
$200-500M
$80-150/t CO₂
8-15 yrs
2026-30
Oxyfuel / direct separation
$300-700M
$60-120/t CO₂
10-15 yrs
2030+
Full net-zero plant (all levers combined)
$500M-$1.5B
$50-100/t CO₂ avg
Varies
2035-50
The sequencing principle: Start with negative-cost and low-cost levers (efficiency, clinker substitution) that generate savings to fund higher-cost investments (AF infrastructure, CCUS). Companies that skip the foundation and jump to CCUS face both higher total cost and higher execution risk.
Why Maintenance Excellence Is the Foundation of Decarbonization
Every decarbonization lever depends on equipment that works reliably. Efficiency gains vanish when preheater seals leak. AF systems fail when feed equipment isn't maintained. CCUS plants have 30-50% more equipment than conventional plants — with higher maintenance intensity. The decarbonization roadmap starts with the CMMS.
Pillar 1
Clinker Substitution
Requires: Reliable grinding systems, consistent SCM feed, quality control integration to maintain product specs across blended cements
Pillar 2
Alternative Fuels
Requires: AF handling, storage, and dosing equipment — all new asset types requiring dedicated PM programs, corrosion management, and safety systems
Pillar 3
Energy Efficiency
Requires: Seals, refractories, burners, cooler plates, and instrumentation all in optimal condition. Efficiency = maintenance.
Requires: 30-50% more assets to maintain — absorber columns, amine pumps, compressors, CO₂ pipelines, storage well integrity. The most maintenance-intensive lever by far.
FOUNDATION
CMMS (OXmaint)
All 5 pillars connect here: asset tracking, PM scheduling, condition monitoring, carbon KPI integration, compliance documentation, work order management for both legacy and new green assets.
Build the Operational Foundation for Net-Zero
Every decarbonization strategy depends on reliable equipment. OXmaint manages traditional and green assets in one platform — from kiln refractories to CCUS compressors. Free to start.
Can the cement industry realistically reach net-zero by 2050?
Technically, yes — but only with the full deployment of all five pillars, including CCUS at scale. The IEA's Net-Zero Emissions scenario and the GCCA's 2050 Roadmap both show pathways to net-zero cement, but they require clinker substitution reducing the clinker factor below 0.60, alternative fuels reaching 60%+ TSR globally, energy efficiency at best-practice levels, full renewable electrification, and CCUS capturing 50-60% of remaining emissions. The technology exists or is in advanced development for every lever. The constraint is deployment speed, capital availability, and regulatory support.
What is CCUS and why is it essential for cement?
Carbon Capture, Utilization, and Storage captures CO₂ from the flue gas before it enters the atmosphere, then either stores it permanently underground (CCS) or converts it into useful products (CCU). It's essential for cement because ~60% of emissions come from the calcination chemistry — CO₂ that cannot be eliminated by using cleaner fuel or renewable energy. CCUS is the only technology that can address this process emission. Without it, the cement industry can achieve roughly 40-50% reduction but cannot reach net-zero.
What is LC3 cement and why is it considered a breakthrough?
LC3 (Limestone Calcined Clay Cement) replaces up to 50% of clinker with a combination of calcined clay and limestone. It reduces CO₂ by up to 40% compared to OPC while maintaining equivalent or better performance in most applications. It's considered a breakthrough because clay is globally abundant (unlike fly ash or slag), the calcination temperature for clay (~750°C) is lower than for clinker (~1,450°C), and it can be produced on existing cement plant equipment with modest modifications. India, Cuba, Colombia, and several African nations are already producing LC3 at commercial scale.
How much does carbon capture cost for a cement plant?
Current estimates range from $60-150 per tonne of CO₂ captured, depending on technology, scale, and local conditions. For a 1.5 Mt/yr cement plant emitting ~1.2 Mt CO₂/yr, capturing 90% would cost $65-160 million annually in operating costs, plus $200-500 million in capital investment. These costs are expected to decline 30-50% by 2035 as technology matures and scales. The economics become viable when carbon prices exceed the abatement cost — which is already the case in the EU for some configurations.
What should cement companies do first on decarbonization?
Start with three simultaneous actions: first, implement digital carbon tracking to establish a baseline and enable real-time monitoring of CO₂ per tonne; second, capture the low-hanging fruit — energy efficiency improvements, clinker factor reduction through blended cements, and initial AF substitution all have negative or low abatement costs; third, begin planning for medium-term investments in LC3 conversion, higher AF substitution, and renewable power procurement while monitoring CCUS technology maturation. The operational foundation (CMMS, digital tracking, maintenance excellence) must be in place before large capital projects can deliver their expected returns.
How does maintenance relate to decarbonization?
Maintenance is the silent enabler — or destroyer — of decarbonization performance. Deferred maintenance adds 5,000-12,000 tonnes of excess CO₂ per plant per year through efficiency losses, unplanned stops, and suboptimal combustion. Every decarbonization lever introduces new equipment that requires maintenance: AF handling systems, SCM grinding, WHR turbines, and eventually CCUS plant (30-50% more assets than a conventional plant). A CMMS that tracks both carbon KPIs and equipment health allows maintenance teams to prioritize work orders by their carbon impact as well as their reliability impact.