Fuel is one of the largest operating costs for a delivery fleet, and it moves with pump prices, driver habits, route design, vehicle condition, and idle time. Most fleets watch the fuel invoice but manage very little of what drives it. The savings come from several small levers pulled together: routing, driving behavior, tire and engine upkeep, fuel card controls, and the move toward hybrid and electric vans. This guide walks through each lever in order, and explains where maintenance management software keeps vehicles in the condition that fuel efficiency depends on.
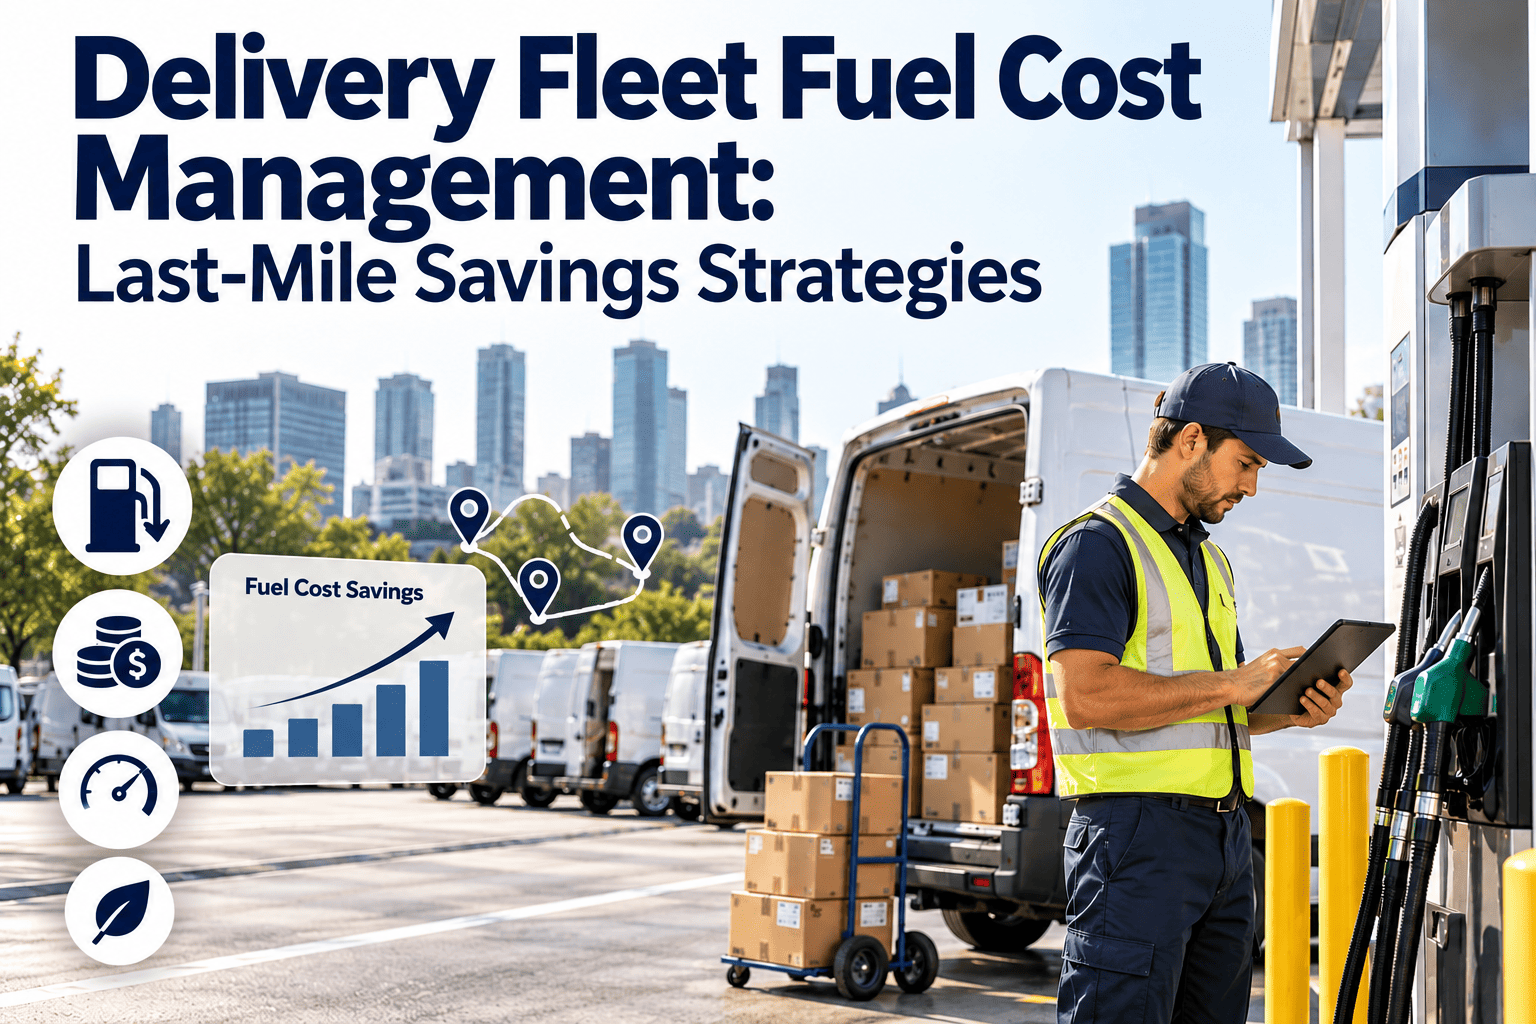
Delivery Fleet Fuel Cost Management: Last-Mile Savings Strategies
Cut fuel spend by managing routes, driver behavior, vehicle condition, fuel cards, and powertrain choices as one connected system.
Why Last-Mile Fuel Cost Is Hard to Control
Last-mile vans stop and start constantly, carry changing loads, and spend long periods idling at the curb. Those conditions make fuel use much more variable than on a long highway route.
Because every driver and vehicle behaves differently, the first requirement is measurement at the vehicle level.
The Five Fuel Levers in Order of Control
Lever 1: Route Fuel Modeling
Fuel follows distance and driving conditions. A route that looks short on a map can burn more if it forces heavy traffic, steep climbs, or many left turns across busy roads.
- Plan routes by road distance and expected travel time, not straight-line distance.
- Group stops into compact clusters so fewer kilometers are driven without a parcel to drop.
- Compare planned distance with actual distance, and investigate routes where drivers regularly deviate.
- Avoid dispatching part-loaded vans on long legs when a neighboring route could absorb the stops.
- Review routes seasonally, since traffic patterns and delivery volumes change through the year.
- Use actual stop duration and traffic data from past routes to improve the next plan, instead of relying on averages.
- Consider which stops require long approaches, such as dead-end access roads, and group those deliveries together.
Denser routes are also easier to measure, because the same vehicle covers a similar pattern every day.
Lever 2: Driver Behavior and Telematics
Telematics devices record speed, braking, acceleration, idle time, and location. Fuel savings come from using that data in coaching, not from collecting it.
| Behavior | Why it wastes fuel | What to track |
|---|---|---|
| Excessive idling | Engine burns fuel while the van is not moving | Idle minutes per shift and per stop |
| Harsh acceleration | Large throttle inputs use more fuel per kilometer | Harsh acceleration events per 100 km |
| Harsh braking | Wastes momentum built with fuel | Harsh braking events per 100 km |
| Speeding | Aerodynamic drag rises quickly with speed | Time above target speed |
| Rolling stops and poor anticipation | Forces repeated stop-start cycles | Stop events versus planned stops |
| Unnecessary engine use | Running cargo heaters or accessories off-duty | Engine hours versus driving hours |
Coaching that works
- Share individual results privately and compare against the fleet average, not only the best driver.
- Focus on one or two behaviors at a time, such as idling and harsh acceleration.
- Recognize improvement publicly so the program is not seen only as monitoring.
- Check route and vehicle conditions before blaming a driver for poor results.
Lever 3: Vehicle Condition
A poorly maintained van burns more fuel for the same route. This is the lever where maintenance planning has the most direct effect.
- Under-inflated or unevenly worn tires
- Dirty air filters restricting airflow
- Faulty oxygen or other engine sensors
- Dragging brakes or misaligned wheels
- Old engine oil that no longer meets specification
- Unneeded weight and roof or body damage that increases drag
- Tire pressure checks in every pre-trip inspection
- Scheduled filter and oil changes by mileage or hours
- Alignment and brake checks at set intervals
- Engine fault codes reviewed and repaired promptly
- Load audits to remove carried-over equipment
- Body and aerodynamic damage added to the repair list
Tire pressure deserves special attention. Under-inflation raises rolling resistance and wears tires faster, so a fast pre-trip check pays back in both fuel and tire cost.
Keep Every Van Tuned for Fuel Efficiency
Schedule preventive maintenance, log pre-trip tire checks, and track repairs per vehicle so fuel-wasting faults do not run unnoticed.
Lever 4: Fuel Card Controls and Exception Reporting
Fuel cards give visibility into where, when, and how much fuel was purchased. They also create the data needed to catch errors and misuse.
Fuel purchased divided by distance driven also shows vehicles whose efficiency is declining, which often points to a mechanical fault.
Lever 5: Hybrid and Electric Delivery Vans
Electrified vans can lower energy cost per kilometer on suitable routes. The business case depends on route length, depot charging access, utility rates, and incentives in your region.
| Factor | Diesel or petrol van | Hybrid van | Electric van |
|---|---|---|---|
| Energy source | Fuel purchased at stations | Fuel plus battery recovery | Electricity, often at the depot |
| Best route type | Long or variable routes | Mixed urban and suburban | Predictable routes returning to depot |
| Stop-start efficiency | Weaker | Better | Strong, with regenerative braking |
| Infrastructure | Existing fuel supply | Existing fuel supply | Depot chargers and power capacity |
| Maintenance focus | Engine, exhaust, transmission | Engine plus battery and hybrid system | Battery, charging, brakes, tires, thermal system |
Questions before adding electric vans
- Do daily route distances fit the usable range, including cold or hot weather?
- Is there enough depot power and parking for overnight charging?
- Are drivers and technicians trained for high-voltage safety?
- How will charger uptime and battery condition be monitored?
- What is the plan for the vehicles being replaced?
Fuel KPIs Every Fleet Should Track
Compare each measure with the same vehicle last quarter, not only with the fleet average, so real improvement is visible.
How Oxmaint Supports Fuel Efficiency Through Maintenance
Oxmaint is maintenance management software. It does not control fuel cards or telematics, but it keeps the vehicle condition that fuel efficiency depends on under control.
- Tire checks depend on memory
- Service dates tracked in spreadsheets
- Fault codes ignored until failure
- Repeat problems unnoticed
- Pre-trip inspection checklists on mobile
- Preventive schedules by mileage or hours
- Work orders for every reported defect
- History and cost per vehicle in one record
Capabilities relevant to fuel cost
- Preventive maintenance for oil, filters, tires, alignment, and brakes.
- Inspections that capture tire pressure, leaks, and visible damage before dispatch.
- Work orders that track corrective repairs, parts, labor, and downtime.
- Inventory for filters, tires, and consumables so service is not delayed.
- Reports that compare maintenance cost with other vehicle data to spot problem vehicles.
A Practical 60-Day Fuel Reduction Plan
Fuel Cost Questions
Idle Time: The Quiet Fuel Drain
Idling produces no distance and no delivery, yet the engine keeps burning fuel. Last-mile vans idle more than most fleets estimate.
- Set an idle threshold in telematics and alert drivers when it is exceeded.
- Use start-stop systems where the vehicle supports them, and keep them in working order.
- Report idle minutes per stop, so idle caused by access problems can be fixed at source.
- Check that cabin heating or cooling is not forcing drivers to leave engines running.
Some idling is operational and legitimate. The goal is to remove the avoidable part, not to punish drivers for waiting at locked gates.
Pre-Trip Checks That Protect Fuel Efficiency
A two-minute check before dispatch catches problems that raise fuel use all day.
- Tire pressure and visible tread or sidewall damage.
- Dashboard warning lights and stored fault codes.
- Fluid levels and any visible leaks under the vehicle.
- Brakes: no dragging, unusual noise, or hot wheels after the previous shift.
- Load: only planned parcels and equipment on board.
- Roof racks, doors, and body panels secure and undamaged.
When results are recorded digitally, repeat issues on the same vehicle show up in reports rather than staying in drivers' memories.
Managing Fuel Price Volatility
You cannot control pump prices, but you can reduce how much a price swing hurts the budget.
| Approach | How it helps | Watch out for |
|---|---|---|
| Fuel cost per delivery tracking | Shows when a price rise needs a rate or surcharge response | Needs consistent data by route |
| Fuel surcharges in customer contracts | Passes part of price movement to customers | Contract terms and competitor pricing |
| Fixed-price or hedging arrangements | Stabilizes budget for part of volume | Can lock in a price above market |
| Reducing consumption | Lowers exposure to any price level | Requires ongoing management |
| Fleet mix review | Shifts exposure toward electricity where suitable | Charging and capital cost |
Reducing consumption is the one approach that helps at any price, which is why behavior and maintenance programs keep their value when prices fall.
Seasonal and Weather Effects
- Cold weather increases fuel use through longer warm-up, denser air, and lower tire pressure, so pressure checks matter more.
- Hot weather raises air-conditioning load and can stress cooling systems, which should be inspected before summer.
- Rain and snow slow traffic and increase idle and stop-start driving.
- Peak season adds load weight and stop count, so efficiency per stop may fall even when drivers behave well.
- Compare each vehicle with its own history for the same season, not only with the previous month.
Seasonal comparison prevents false alarms in winter and false comfort in spring.
Common Fuel Management Mistakes
- Tracking fuel spend but not fuel per vehicle
- Blaming drivers for faults that are mechanical
- Collecting telematics data without a coaching routine
- Delaying service to protect route capacity
- Judging electric vans on purchase price alone
- Measuring each vehicle against its own baseline
- Checking vehicle condition before reviewing behavior
- Using weekly coaching with simple targets
- Scheduling service on low-volume days
- Comparing total cost across energy, maintenance, and charging
Reporting Fuel Results to Finance
Finance teams respond to clear, comparable numbers. A monthly one-page summary is usually enough.
- Total fuel cost against budget, with the price effect separated from the volume effect.
- Fuel cost per delivered parcel and per route kilometer.
- Top and bottom vehicles by efficiency, with the reason for each gap.
- Savings achieved from specific actions, such as idle reduction or tire programs.
- Planned actions for the next month, with an owner for each.
Lower Fuel Cost by Keeping Vehicles in Condition
Pair routing and driver coaching with disciplined maintenance. Use Oxmaint to schedule preventive service, run inspections, and keep a cost record for every vehicle.