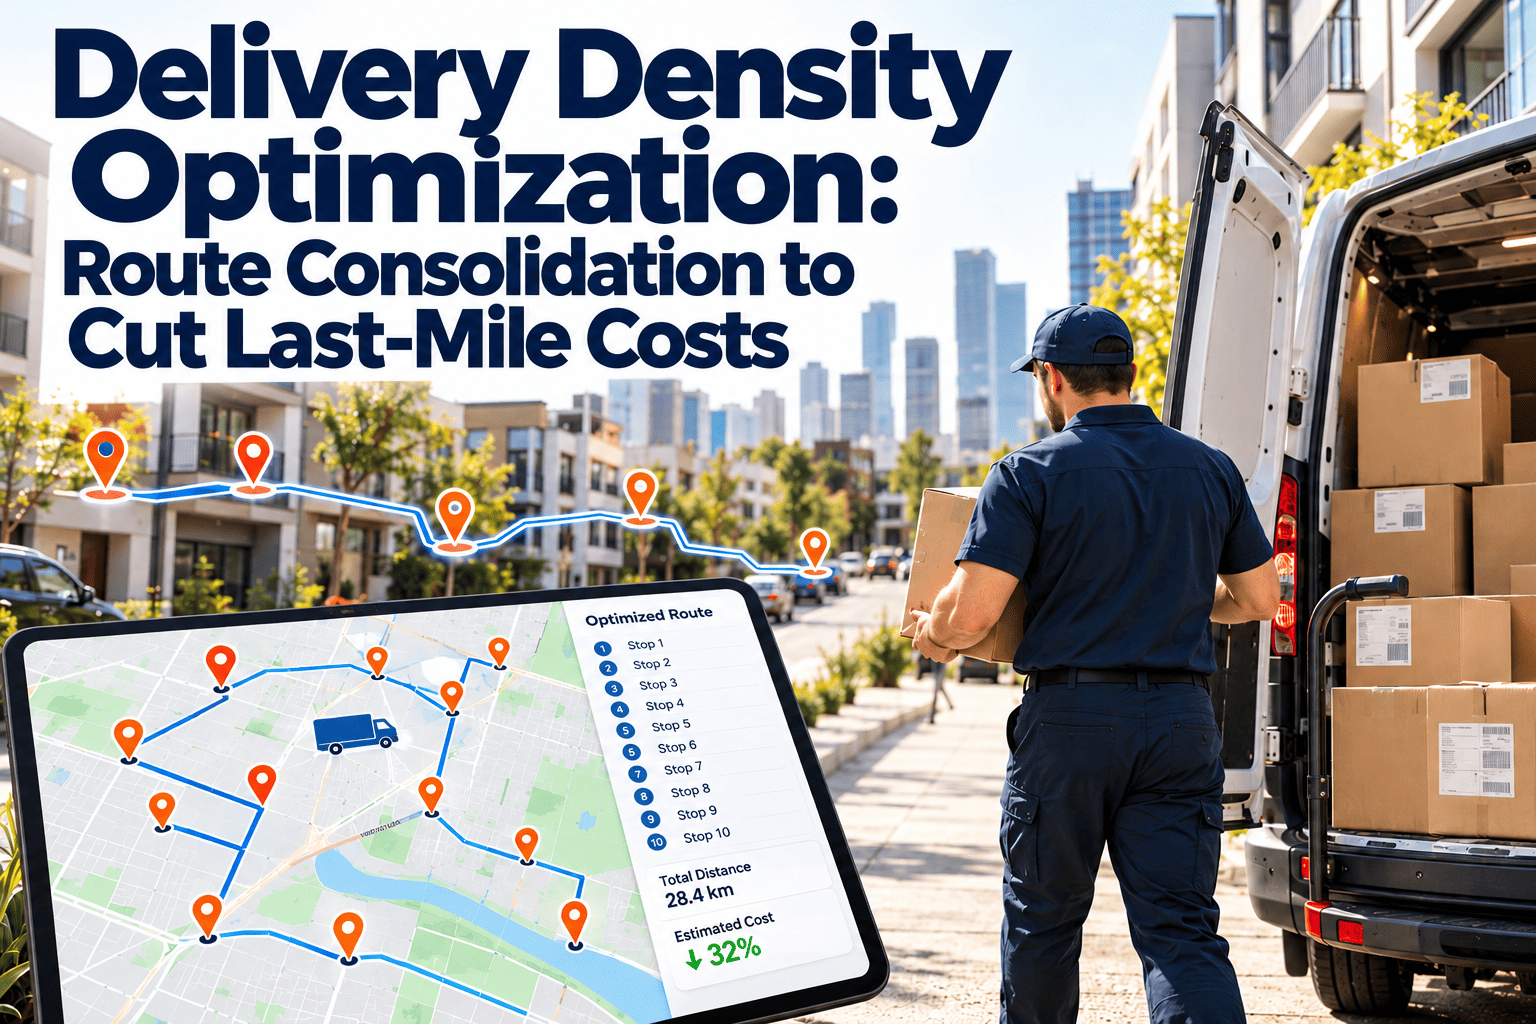
Every extra kilometer between two stops is paid for in fuel, driver hours, and vehicle wear, yet most last-mile teams track cost per route instead of cost per stop. Delivery density, the number of stops a driver can serve in a given area and time, decides how far that route cost is spread. Raising it through demand clustering and route consolidation is one of the most direct ways to lower last-mile cost. This guide shows how to measure density, consolidate routes without breaking service windows, and keep the fleet healthy with maintenance management software.
Delivery Density Optimization: Route Consolidation to Cut Last-Mile Costs
Sparse routes make every parcel more expensive. Learn how to measure stops per route hour, cluster demand, consolidate routes, and protect vehicle uptime so denser routes actually run.
What Delivery Density Actually Measures
Last mile delivery density describes how closely your stops are packed along a route. A dense route spends most of its shift serving customers. A sparse route spends it driving between them.
Route density optimization is the work of pushing the first three up and the last one down, without missing delivery commitments.
Why Sparse Routes Cost So Much
Most route costs are fixed once the driver leaves the depot. Wages, vehicle ownership, insurance, and depreciation do not shrink when stops are far apart, so each stop carries a larger share.
| Root cause | What it does to cost | What to measure |
|---|---|---|
| Scattered postcodes on one route | More empty kilometers per parcel | Stops per kilometer |
| Narrow or rigid time windows | Forces zig-zag sequencing and idle waiting | Window width by zone |
| Failed first attempts | Repeat visits with no new revenue | First-attempt success rate |
| Long service time at stop | Fewer stops fit in a shift | Minutes per stop by building type |
| Static routes planned weekly | Daily demand shifts are ignored | Planned versus actual distance |
| Vehicle breakdowns mid-route | Stops get reassigned and density collapses | Unplanned downtime hours |
A Simple Cost-per-Stop Example
The figures below are hypothetical, chosen only to show the arithmetic. Substitute your own route costs.
- Daily route cost: 400
- Stops completed: 40
- Cost per stop: 10.00
- Daily route cost: 400
- Stops completed: 60
- Cost per stop: 6.67
The route costs the same to run, yet each stop is one third cheaper. That is the logic behind consolidation: you are not driving less, you are serving more per kilometer.
Measure Your Current Density First
Consolidating blindly can push drivers into overtime and break promises. Build a baseline before changing a single route.
- Export at least four weeks of completed stops with timestamps and coordinates.
- Calculate stops per route hour and stops per kilometer for every route.
- Split drive time from service time, so you know which one is the real constraint.
- Map stop clusters by zone and flag zones with fewer than a workable number of drops per hour.
- Record failed attempts and redeliveries separately, since they inflate stop counts without adding value.
- Compare planned distance with actual distance to see how much drivers deviate.
Most operations discover that a small group of zones accounts for a large share of the wasted kilometers. Start there.
From Scattered Demand to Dense Routes
Delivery clustering groups nearby orders so one driver serves them in one pass. The flow below works for both fixed-route and dynamic networks.
Route Consolidation Tactics That Hold Up
Steer customers toward denser slots
- Offer delivery day or window choices that favor zones already being served.
- Show the denser option first at checkout and price it accordingly.
- Set minimum order values for off-cluster addresses.
Merge thin routes
- Combine routes that finish early with neighboring routes that run long.
- Retire low-volume routes and serve them on alternate days.
- Use a single depot or micro-hub for zones that overlap.
- Review consolidated routes after two weeks, since early assumptions about stop time are often optimistic.
- Agree a realistic upper limit on stops per route with drivers, so density gains do not turn into overtime.
Reduce service time at the door
- Confirm access details before dispatch to avoid waiting at gates.
- Group deliveries to the same building or business park.
- Use alternative drop points where a doorstep attempt keeps failing.
Density Versus Service Window Trade-Offs
Tighter windows reduce density. The matrix below helps decide where to hold firm and where to loosen.
Dynamic Routing and Stops-per-Hour Gains
Static routes are planned once and drift away from reality. Dynamic routing re-sequences stops as orders arrive, cancel, or run late, which helps density hold through the day.
- Insert late orders into the nearest running route instead of dispatching a new vehicle.
- Re-optimize when a delay threatens a time window.
- Use actual stop duration data, not averages, to estimate how many drops fit.
- Keep a small reserve of capacity in each cluster for same-day additions.
- Limit last-minute changes near cutoff so drivers are not handed routes they cannot realistically complete.
- Track how often the optimizer plan and the driver's actual sequence differ, then investigate the largest gaps.
- Review the weakest ten percent of routes each month and decide whether to merge, reprice, or redesign them.
Routing software decides the sequence. It cannot make a van with a failed brake sensor leave the yard, which is why the maintenance side deserves equal attention.
Why Dense Routes Depend on Vehicle Uptime
Dense routes carry more stops per vehicle, so one breakdown affects more customers. A van that fails at stop 12 of 60 leaves dozens of parcels to rescue.
- Faults found during the route
- Stops reassigned at short notice
- Overtime and late deliveries
- Repair history scattered across notes
- Faults caught at pre-trip inspection
- Service scheduled around low-volume days
- Routes stay intact and on time
- Every repair tied to a vehicle record
How Oxmaint supports the maintenance side
Oxmaint is maintenance management software, not a routing engine. It supports the fleet and equipment that dense routes rely on.
- Preventive maintenance schedules based on mileage, engine hours, or calendar dates.
- Work orders for corrective repairs, with assignment, status, and cost tracking.
- Mobile inspection checklists drivers complete before leaving the depot.
- Asset records for each vehicle, including repair history and service dates.
- Inventory tracking for tires, filters, brake parts, and other common spares.
- Reporting and dashboards showing downtime, repeat failures, and maintenance cost per vehicle.
Operational Impact of Low Density Beyond Fuel
Fuel gets the attention, but sparse routes create costs that rarely appear on a single line of the budget.
- Driver time: more paid hours spent moving rather than delivering, which raises labor cost per parcel.
- Vehicle wear: extra kilometers accelerate brake, tire, suspension, and drivetrain wear, so service intervals arrive sooner.
- Capacity: slower routes mean more vehicles are needed to cover the same volume.
- Emissions: more distance per parcel raises emissions per delivery, which matters for customers and for reporting.
- Customer experience: long routes drift late, and late deliveries generate contacts and failed attempts.
The maintenance connection
Distance drives maintenance demand. When a route is consolidated and total kilometers fall, service intervals based on mileage should be reviewed rather than left on the old schedule.
Technology That Supports Density Work
| Tool | Role in density | Maintenance link |
|---|---|---|
| Route optimization software | Clusters stops and sequences routes | Needs reliable vehicles to execute the plan |
| Telematics | Records distance, idle time, and engine hours | Feeds mileage-based service triggers |
| Driver mobile app | Captures stop times and failed attempts | Pre-trip inspection results can follow the same workflow |
| Maintenance management system | Plans service and tracks repairs | Keeps the fleet ready and records cost per vehicle |
The tools work best when their data is connected. Telematics distance, driver reports, and work order history together show which vehicles are costing more than the routes they serve.
Pre-Route Readiness Checklist
A dense route has little slack. A short daily check protects it.
- Tires, lights, brakes, and fluid levels inspected and signed off.
- Load secured and matched to the planned stop sequence.
- Open defects reviewed, with any safety-critical item blocking dispatch.
- Spare vehicle identified for the highest-volume routes.
- Fuel or charge level confirmed for the full planned distance.
- Driver has the latest route and any access notes.
Recording these checks in a maintenance system also builds a history that helps explain repeat failures later.
Keep Your Dense Routes on the Road
Plan vehicle upkeep around your routes, catch faults at pre-trip inspection, and cut the breakdowns that undo consolidation.
Density Strategy by Delivery Environment
One density target will not fit every network. Set separate goals for each environment and judge each against its own baseline.
Questions to ask for every zone
- Is the low density caused by geography, by window rules, or by how routes are built?
- Would a scheduled delivery day raise density without hurting customers?
- Does the zone need a different vehicle size or type?
- Are repeat vehicle failures concentrated on the routes with the longest legs?
Answering these separates problems you can fix through planning from those that need a pricing or coverage decision.
KPIs to Track After Consolidation
| KPI | Why it matters | Warning sign |
|---|---|---|
| Stops per route hour | Core density measure | Flat or falling after changes |
| Cost per stop | Shows financial effect | Rising despite higher density |
| On-time delivery rate | Checks service was protected | Drops as routes get longer |
| Driver overtime hours | Reveals overloaded routes | Growing week over week |
| Unplanned vehicle downtime | Exposes fleet risk to dense routes | Repeat failures on the same asset |
| First-attempt success | Failed drops waste density | Concentrated in certain zones |
Using Maintenance Data to Defend Your Routes
Once routes are consolidated, maintenance records become planning inputs. Three views are worth reviewing monthly.
- Downtime by vehicle: shows which vans repeatedly pull a dense route out of service.
- Cost per kilometer by vehicle: reveals when an aging van costs more to keep than to replace.
- Overdue preventive tasks: warns of risk before it becomes a missed delivery.
Sharing these reports with the routing team gives both groups the same view of which routes are fragile.
A 90-Day Rollout Timeline
Common Mistakes When Improving Density
- Packing routes until drivers cannot finish
- Ignoring access and parking time
- Optimizing distance but not time windows
- Skipping vehicle service to protect volume
- Setting realistic stop counts from actual data
- Using measured service time per stop type
- Balancing density against window commitments
- Scheduling maintenance as part of the plan
Delivery Density Questions
Turn Denser Routes Into Lower Cost per Stop
Consolidation only pays off when vehicles are ready every morning. Use Oxmaint to schedule preventive maintenance, run inspections, and track repairs across your delivery fleet.