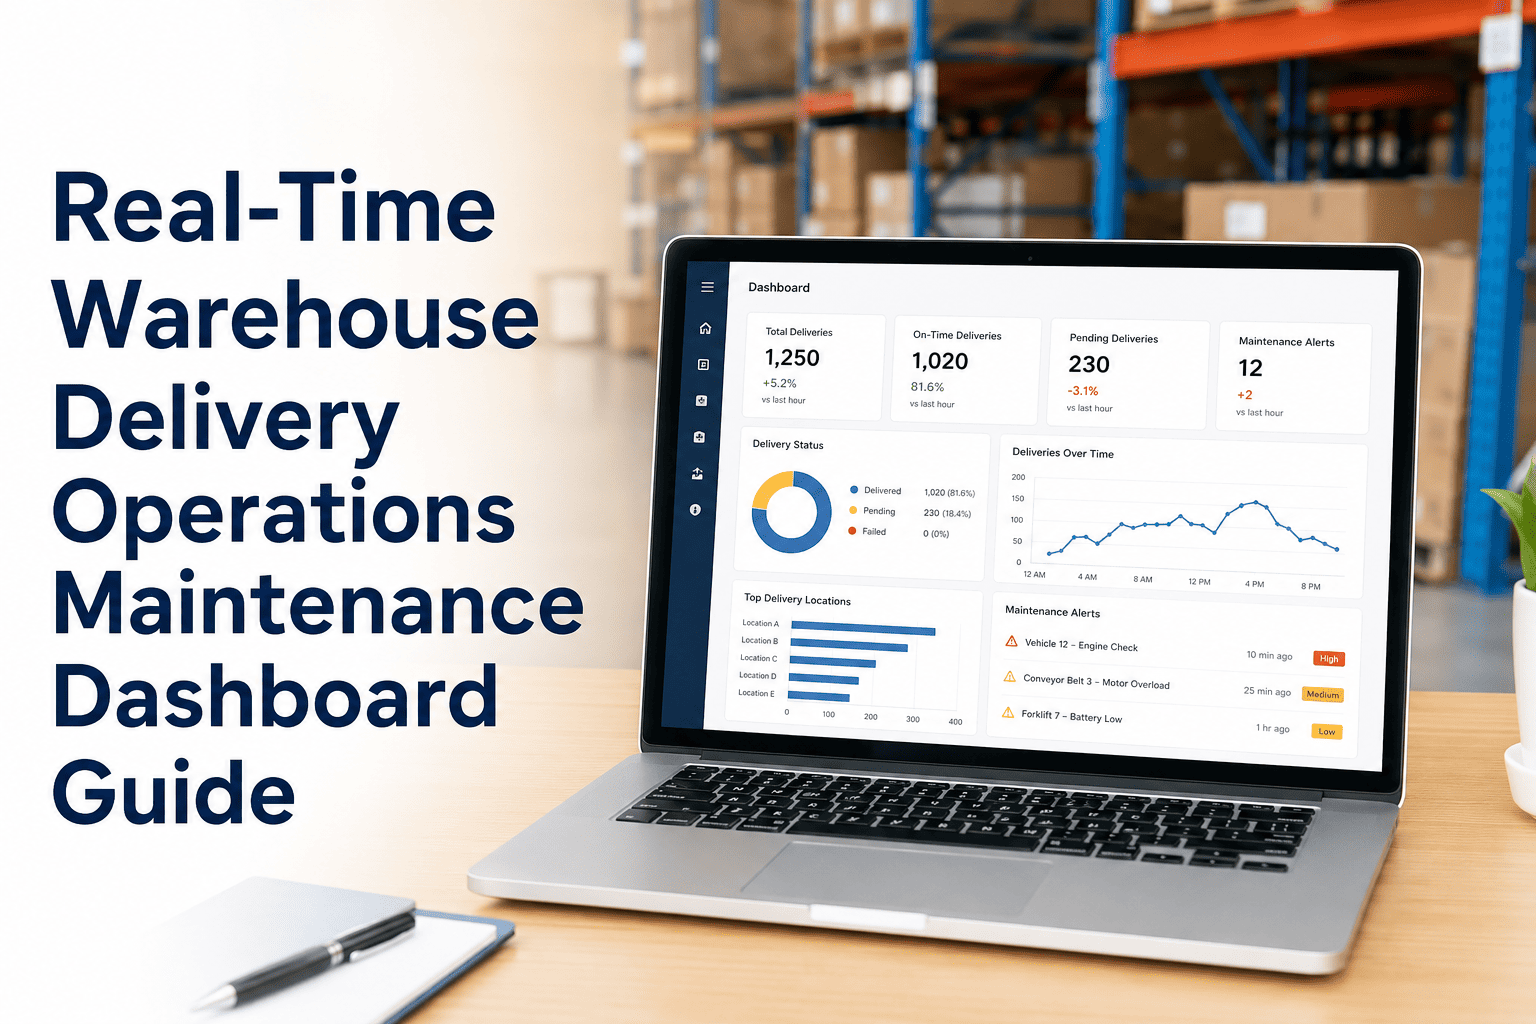
Every warehouse operations manager has faced the same gut-punch moment: a critical forklift, conveyor, or dock leveler goes down during peak shift, orders stack up, SLAs slip, and the team scrambles — while the dashboard on the wall shows everything in green. That dashboard wasn't telling you what was happening right now. It was telling you what happened last week. In delivery operations where every hour of unplanned downtime ripples directly into missed shipments and broken customer promises, "last week" is too late. A real-time CMMS maintenance dashboard changes that equation — giving operations leads, maintenance planners, and floor technicians a single live view of every asset, every alert, and every open work order, updated continuously. This guide shows you exactly what that dashboard looks like, which KPIs belong on it, and what it costs when you don't have one. OxMaint's real-time maintenance dashboard is purpose-built for warehouse and delivery operations — connect your equipment and go live within days.
$125K
Average cost per hour of unplanned equipment downtime (ABB Global Survey, 3,200+ plant managers)
42%
Of all unplanned downtime is caused by equipment failure that was preventable with monitoring
28%
Faster Mean Time To Repair (MTTR) for facilities actively tracking maintenance KPIs (SMRP, 2025)
75%
Reduction in KPI reporting time after deploying a live CMMS dashboard vs. manual spreadsheets
Why Warehouse Operations Can't Afford a Lagging Dashboard
Delivery operations run on tight windows. A distribution center processing 10,000 orders per day cannot absorb two hours of conveyor downtime the way a back-office system can absorb a server update. Equipment failure in a warehouse is never just a maintenance event — it's a customer service event. It's a missed SLA. It's a late shipment. It's a refund request and, in B2B logistics, potentially a contract review.
The problem most warehouses have today isn't a lack of data. Forklifts produce telemetry. Conveyors have PLCs. HVAC units have BMS signals. Dock equipment has cycle counters. The problem is that this data feeds into disconnected silos — some in a BMS, some in a fleet telematics app, some in a spreadsheet someone updates on Fridays. Nobody is watching all of it in one place, in real time, and nobody is being automatically alerted when a pattern starts to look like a failure in progress.
Without a Live Dashboard
Failure discovered at breakdown — hours after warning signs appeared
Emergency technician dispatch at premium labor rates
Parts ordered urgently — 3× standard lead time and cost
Operations manager learns about it from a floor worker, not the system
Post-incident report written from memory, not data
VS
With OxMaint Live Dashboard
Anomaly flagged automatically — 3 to 8 weeks before breakdown
Work order auto-created and sent to planner's queue within minutes
Parts ordered at standard cost during planned window
Operations manager sees it on the dashboard before anyone calls
Full asset history and sensor trend attached to every work order
See Your Warehouse Equipment Health Live
OxMaint connects to existing BAS, SCADA, and IIoT sensors to surface real-time asset health across your entire delivery operation — forklifts, conveyors, dock equipment, and HVAC — in a single dashboard.
What a Best-in-Class Warehouse Maintenance Dashboard Shows
A maintenance dashboard is only as useful as the decisions it enables. For warehouse and delivery operations, that means surfacing the right metric to the right role — without flooding anyone with noise. Here are the six dashboard views that high-performing logistics maintenance teams use every day.
01
Live Asset Health Map
Every piece of equipment on the warehouse floor shown in real time — green for healthy, amber for developing anomaly, red for active alert. Managers see which assets need attention before walking the floor or checking a work order queue.
Key metric: Asset availability rate by zone and shift
02
Open Work Order Aging
Every open work order displayed with time-in-queue, priority, assigned technician, and estimated completion. Planners immediately see which jobs are stalled, which assets are waiting on parts, and where the backlog is building.
Key metric: Work order cycle time vs. target by asset class
03
Preventive Maintenance Compliance
PM schedule adherence tracked in real time — not at month-end. Teams see which PMs are overdue, which are upcoming in the next 7 and 14 days, and whether the current compliance rate will meet the 95% world-class benchmark.
Key metric: PM completion rate vs. 95% benchmark (SMRP)
04
MTTR and MTBF by Asset
Mean Time To Repair and Mean Time Between Failures tracked per asset and per asset class. Operations leads use this to identify which equipment is costing the most in lost uptime and to build data-backed replacement cases for capital requests.
Key metric: MTBF trend direction (rising = improving reliability)
05
Technician Utilization and Workload
Labor hours logged per technician, wrench time vs. administrative time, and workload distribution across the team. Supervisors can see in real time whether tasks are evenly distributed or whether one technician is buried while another has capacity.
Key metric: Wrench time percentage (world-class target: 55%+)
06
Reactive vs. Planned Maintenance Ratio
The single most revealing indicator of maintenance program health. A facility spending more than 30% of maintenance hours on reactive repairs is on a trajectory toward more frequent, more expensive breakdowns. This view tracks the ratio and shows its trend over time.
Key metric: Planned maintenance percentage (target: 70%+ planned)
Warehouse Equipment That Needs Live Monitoring Most
Not every asset carries the same operational risk if it goes down. In a delivery warehouse, a handful of critical systems determine whether orders ship on time. These are the assets that belong on your real-time dashboard first.
| Equipment |
Failure Impact |
Key Signal to Monitor |
Detection Window |
Early Fix Cost vs. Breakdown |
| Forklifts and reach trucks |
Picking halted, loading dock backed up |
Hydraulic pressure, battery health, motor temperature |
7–14 days |
$600 service vs. $8,000+ repair |
| Conveyor systems |
Entire fulfillment line stops |
Belt tension, motor current draw, roller vibration |
10–21 days |
$400 belt adjust vs. $15,000 replacement |
| Dock levelers and doors |
Receiving and shipping blocked |
Cycle counts, hydraulic pressure, motor runtime |
3–7 days |
$300 adjust vs. $4,500 actuator replacement |
| Warehouse HVAC and refrigeration |
Cold chain breach, worker safety risk |
Compressor current, discharge temp, refrigerant pressure |
14–28 days |
$800 PM vs. $40,000 compressor replacement |
| Automated sorting systems (AS/RS) |
Order throughput drops to zero |
Drive motor current, encoder accuracy, sensor health |
7–14 days |
$1,200 service vs. $25,000+ system repair |
| Pallet jacks and tuggers |
Inbound staging delayed, cross-dock risk |
Battery discharge rate, motor load, wheel wear indicators |
5–10 days |
$200 battery service vs. $3,000 motor replacement |
How OxMaint Builds a Live Dashboard for Warehouse Operations
Most facilities already have the sensor data — it's just not connected to a system that converts it into live maintenance decisions. OxMaint's integration pipeline connects existing signals to an automatic work order engine in four steps.
Step 1
Connect existing data sources
OxMaint ingests signals from BAS systems, SCADA feeds, fleet telematics, wireless IIoT sensors, and manual inspection logs. Integration uses OPC-UA, MQTT, BACnet, and Modbus — no custom development required for most warehouse environments.
Step 2
Build a dynamic baseline per asset
The AI builds a rolling 90-day statistical baseline per sensor per asset. Seasonal load, ambient temperature, shift patterns, and throughput variation are all accounted for — so alarms fire on genuine anomalies, not normal operating variation.
Step 3
Correlate signals across sensors
A single sensor reading above threshold is logged but does not escalate. OxMaint confirms an anomaly only when multiple sensors deviate simultaneously in a pattern matching a known failure signature — eliminating the false alarms that cause maintenance teams to ignore alerts.
Step 4
Auto-generate work orders with full context
Confirmed anomaly creates a work order pre-populated with fault type, affected asset, anomaly trend chart, deviation magnitude, and recommended action — in the planner's queue within minutes of detection. No dashboard monitoring required from the team.
KPIs Your Dashboard Must Track — and What They Tell You
MTBF
Mean Time Between Failures
Measures how long equipment reliably operates between breakdowns. A rising MTBF trend means your PM program is working. A falling trend means something is systematically degrading — often a single high-failure asset pulling the average down.
MTTR
Mean Time To Repair
How quickly your team restores equipment to service after a failure. High MTTR reveals parts availability issues, technician skill gaps, or unclear work procedures. Facilities tracking MTTR see 28% faster repairs on average (SMRP, 2025).
PM %
Planned Maintenance Percentage
The ratio of planned maintenance hours to total maintenance hours. Below 70% means your team is spending more time reacting to failures than preventing them. World-class operations sustain 85% or above — achievable only with a live schedule dashboard.
OEE
Overall Equipment Effectiveness
Combines availability, performance rate, and quality rate into a single asset efficiency score. In warehouse operations, OEE applied to conveyors and AS/RS systems shows exactly how much throughput capacity is being lost to maintenance-related slowdowns.
CPA
Cost Per Asset (Maintenance Spend)
Total maintenance labor, parts, and contractor cost allocated per asset over time. This is the metric that makes capital replacement decisions obvious — when a forklift's annual maintenance cost approaches 30–40% of its replacement value, the data speaks for itself.
Backlog Aging
Work Order Queue Health
Open work orders by age shows where planned maintenance is slipping into reactive repair territory. A growing backlog of 7+ day-old work orders is a leading indicator of under-resourcing, parts shortages, or a PM schedule that's falling behind during peak periods.
Stop Managing Maintenance from Last Week's Spreadsheet
OxMaint's live dashboard tracks MTTR, MTBF, PM compliance, work order aging, and asset health simultaneously — updated automatically from every work order your technicians close. No manual data entry. No end-of-month scramble.
Role-by-Role: What Each Team Member Sees on the Dashboard
A single dashboard that tries to serve everyone ends up serving no one. OxMaint provides role-specific views so each team member sees exactly the information that drives their next decision.
Operations Manager
Sees: Asset uptime by zone, active alerts, SLA risk flags, today's open work orders vs. capacity
Makes: Shift reallocation decisions, escalation calls, and SLA exception communications — before the floor calls
Maintenance Planner
Sees: Work order queue by priority and age, technician workload balance, PM schedule vs. compliance, parts availability
Makes: Daily dispatch decisions, parts pre-orders, PM rescheduling around peak throughput windows
Floor Technician
Sees: Personal work queue on mobile, asset history, attached fault trend chart, recommended parts list per job
Arrives: With the right diagnosis, right parts, and right history — reducing average repair time significantly
VP / Director of Operations
Sees: Portfolio-level uptime across all sites, maintenance cost per asset, reactive vs. planned ratio trend, budget vs. actual spend
Makes: Capital replacement approvals, headcount justification, and vendor performance decisions — backed by live data
Frequently Asked Questions
What sensors does OxMaint need to build a real-time warehouse dashboard?
OxMaint connects to data you already have — BAS signals, fleet telematics, SCADA outputs, and manual inspection logs. For assets without existing sensors, wireless IIoT devices can be retrofit-mounted in under two hours and begin feeding the dashboard immediately. Most warehouses are fully connected within 2–4 weeks of deployment.
Start a free trial to see what's connectable in your facility.
How is a real-time CMMS dashboard different from a standard BMS alarm system?
A BMS alarm fires when a single sensor crosses a fixed threshold — which is often too late and generates significant false positives. OxMaint's dashboard correlates multiple sensors against a dynamic rolling baseline, confirming a fault only when the multi-sensor pattern matches a known failure signature. The result is 3–8 weeks of advance warning instead of a breakdown alarm.
Book a demo to see the difference in action.
Can the dashboard cover multiple warehouse sites in one view?
Yes. OxMaint's portfolio dashboard aggregates asset health, active alerts, work order status, and maintenance KPIs across all sites on a single screen. Directors and VPs can identify which facilities have developing equipment issues and where maintenance spend is trending upward, without switching between systems or waiting for weekly reports.
How quickly does OxMaint generate a work order when an anomaly is detected?
Confirmed anomalies generate a work order within minutes of pattern confirmation. The work order arrives in the planner's queue pre-populated with the fault type, asset details, sensor trend chart, deviation magnitude, and recommended action — no manual triage required from the maintenance team.
What is a realistic timeline to see the dashboard live after signing up?
Most warehouse operations are connected and running a live dashboard within 2–4 weeks. Facilities with existing BAS or SCADA infrastructure are often live in under two weeks.
Start a free trial today or
book a 30-minute walkthrough to see a deployment plan for your specific facility.
Your Warehouse Equipment Is Sending Signals Right Now
OxMaint reads them — correlates vibration, current, temperature, and pressure against a live asset baseline — and turns developing faults into planned work orders weeks before breakdown. Connect your facility and go live on a real-time maintenance dashboard this week.