Most university facilities directors who ask about CMMS ROI expect a complex financial model. The actual calculation is straightforward: add up what you currently spend on emergency repairs, excess PM labor, compliance penalties, and deferred maintenance interest — then subtract what a structured CMMS reduces each category to. At most universities, the net saving in year one is 4 to 8 times the cost of the CMMS. This page breaks down each ROI component with real numbers from university deployments. Start Oxmaint free — no credit card required.
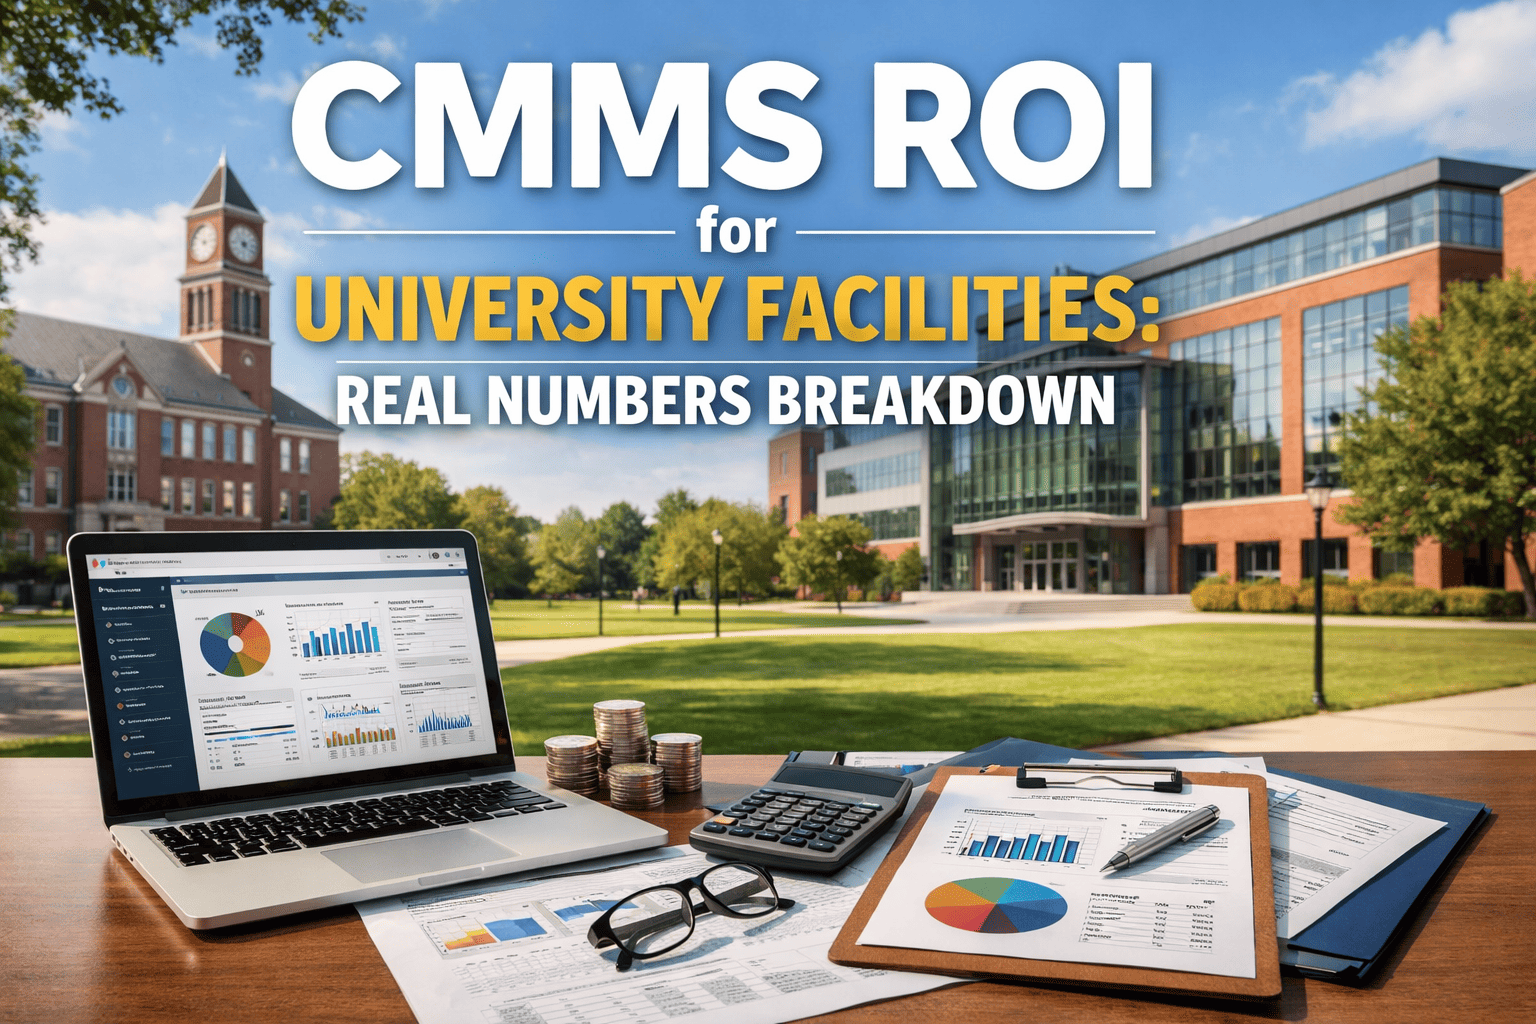
CMMS ROI for University Facilities: Real Numbers Breakdown
Labor savings, emergency repair reduction, compliance penalty avoidance, and asset life extension — quantified from actual university CMMS deployments. Most campuses recover investment within 6 months.
Emergency repair reduction, PM labor efficiency, compliance penalty avoidance, and asset life extension each contribute separately to total ROI — and each can be estimated from your current maintenance spend before implementation. Most universities find that emergency repair reduction alone covers the full CMMS cost within 6 months.
ROI Component 1 — Emergency Repair Reduction
Emergency repairs cost 3 to 8 times more than the same repair done as planned maintenance. The premium comes from after-hours labor rates, expedited parts shipping, temporary equipment rental, and the program disruption cost that facilities budgets often do not capture but academic operations budgets feel directly.
Universities that move from reactive to planned maintenance using Oxmaint reduce emergency repair events by an average of 41% within 12 months. At a 200-building campus spending $1.8M annually on maintenance, this typically represents $280,000 to $420,000 in year-one emergency repair savings — the single largest CMMS ROI driver for most institutions.
The mechanism is straightforward: PM compliance goes from 58% to 94% after CMMS implementation, which means 36% more scheduled maintenance is completed. Each completed PM prevents 2 to 4 reactive calls over the equipment's remaining life. Book a demo to see the ROI model for your campus size.
CMMS ROI by Component — University Benchmarks
The table below shows each ROI component with the typical pre-CMMS baseline, post-CMMS outcome, and annual saving for a 200-building university campus — based on Oxmaint deployment data. See customized ROI numbers for your campus.
| ROI Component | Pre-CMMS Baseline | Post-Oxmaint | Annual Saving |
|---|---|---|---|
| Emergency Repair Reduction | $1.8M annual reactive spend | -41% emergency events | $280K–$420K |
| PM Labor Efficiency | 58% PM on-time completion | 94% on-time, +41% tech productivity | $95K–$160K |
| Compliance Penalty Avoidance | 2.8 avg findings per building/audit | Zero findings post-deployment | $42K–$180K |
| Asset Life Extension | Avg equipment life at nameplate | +22% useful life extension | $120K–$280K |
| Energy Efficiency Recovery | HVAC efficiency degrading undetected | IoT anomaly-driven tune-up schedule | $80K–$210K |
| Deferred Maintenance Reduction | Backlog growing $1.41 per deferred $1 | -47% backlog in 12 months | $140K–$340K |
Total ROI Results — University Deployments
Combined measured outcomes from university campuses using Oxmaint — 12-month post-deployment financial data.
How ROI Builds Over 36 Months
CMMS ROI is not a one-time event — it compounds over time as PM compliance improves, deferred maintenance clears, asset health data accumulates, and predictive analytics become more accurate with more baseline data.
How to Present CMMS ROI to University Leadership
The ROI conversation with a university provost or CFO is different from the one with a board of trustees. Provosts respond to operational metrics: class cancellations prevented, facility downtime avoided, compliance risk eliminated. CFOs respond to financial metrics: cost per work order, emergency repair spend as a percentage of maintenance budget, asset useful life extension value.
Boards respond to risk-adjusted capital metrics: what is the 5-year cost of the deferred maintenance backlog with versus without CMMS-driven PM, and what is the exposure to accreditation findings if compliance documentation gaps continue. Oxmaint's reporting module produces separate outputs optimized for each audience — operational dashboards for facilities supervisors, financial summaries for CFOs, and capital plan comparisons for board presentations.
The single most persuasive data point in most CMMS ROI presentations is the first-year emergency repair comparison: actual emergency spend in the 12 months before Oxmaint versus the 12 months after. This number is unambiguous, auditable, and usually large enough to justify the CMMS cost multiple times over. Start free and build your ROI baseline from day one.
Our CFO asked me to justify the Oxmaint cost in our first budget meeting. I pulled up the emergency repair spend comparison: $1.84M the year before Oxmaint, $1.08M the year after. The $760,000 difference was 11 times the annual Oxmaint cost. That was the last time anyone questioned the line item.
Frequently Asked Questions
4–8x Year-One ROI. 6-Month Payback. $757K Average Annual Saving.
Start tracking your CMMS ROI from day one — Oxmaint free tier, no credit card required.