Most facility maintenance programs don't fail because teams lack effort — they fail because there is no multi-year plan connecting today's work orders to tomorrow's reliability goals. A facility fighting the same breakdowns in year three that it fought in year one usually never mapped a sequenced path from reactive firefighting to a measured, budgeted maintenance strategy. Industry research shows that while most facilities now run some form of CMMS, the majority still use it only as a work order log rather than the backbone of a forward-looking plan, and predictive programs stall at the pilot stage without a clear roadmap tying data, assets, and budget together. A facility maintenance strategy roadmap fixes that gap by sequencing exactly which assets get preventive schedules first, which earn condition monitoring next, and which move to predictive, data-driven decisions by year three. Book a demo to see how OxMaint's CMMS supports every stage of a three-year facility maintenance strategy roadmap.
Guide · Facility Maintenance Strategy · 3-Year Roadmap
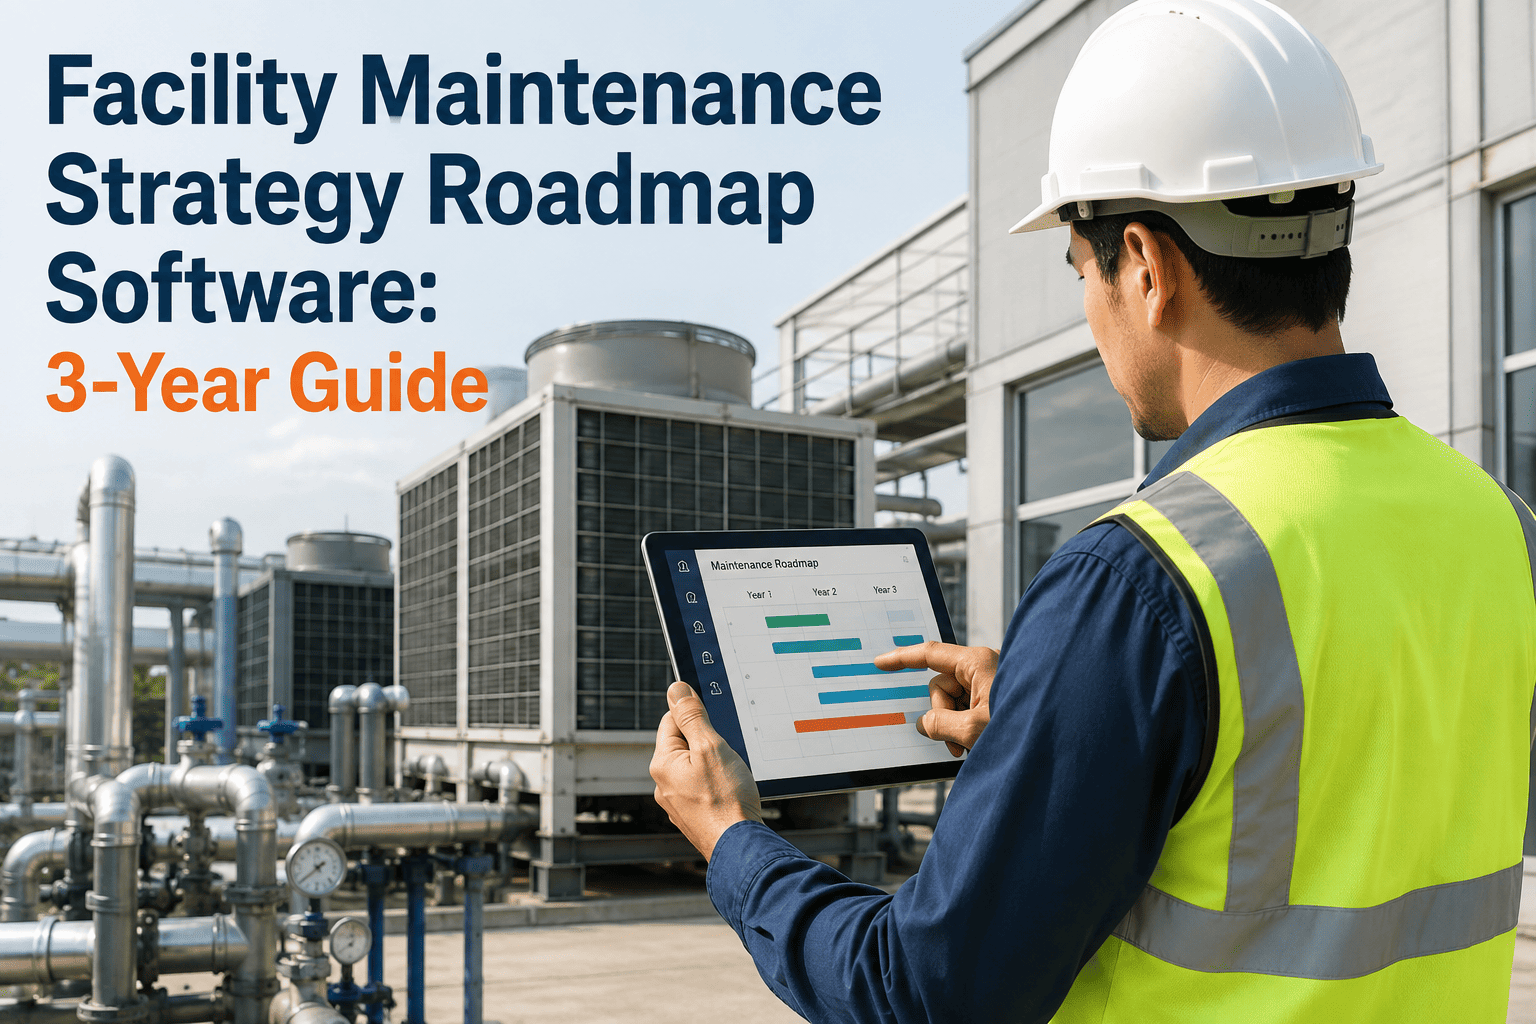
Facility Maintenance Strategy Roadmap Software: The 3-Year Guide
A year-by-year plan for moving a facility maintenance program from reactive firefighting to a measured, predictive strategy — with the milestones, KPIs, and CMMS capabilities each stage actually requires.
28%
Average downtime reduction once a facility moves from reactive to predictive maintenance
25%
Typical maintenance cost reduction achievable with a mature, roadmap-driven program
3 in 5
Facilities running a CMMS today without a written multi-year maintenance strategy
Why a Facility Needs a 3-Year Roadmap, Not a Quarterly Fix
Facility teams under budget pressure tend to solve the loudest problem this month and move on. That approach keeps the lights on, but it never builds the data, staff skills, or asset history needed to escape reactive mode. A written three-year roadmap forces a different conversation — instead of asking "what broke this week," leadership asks "what does this facility need to look like in twelve, twenty-four, and thirty-six months," and every purchase, PM schedule, and staffing decision is measured against that target. Facilities that plan this way consistently outperform ones that don't, because every stage of the roadmap is designed to fund the next one through documented savings rather than a single large upfront investment.
Year 1
Stabilize — Reactive to Preventive
The first year is about stopping the bleeding. Every asset gets a digital record, every recurring failure gets a preventive maintenance schedule, and every work order moves out of email threads and paper logs into one system of record. Facilities typically see planned maintenance percentage climb from under 30% to over 60% within this stage.
Focus: Asset register, PM scheduling, mobile work orders, baseline KPIs (MTBF, MTTR, backlog)
Year 2
Optimize — Condition-Based Monitoring
With clean data flowing from Year 1, the second year introduces condition-based triggers on critical assets — vibration, temperature, and runtime thresholds that convert fixed-interval PMs into as-needed service. This is also when root cause analysis becomes a standard step after every major repair, so recurring failures actually stop recurring.
Focus: Sensor integration on critical assets, root cause workflows, spare parts optimization
Year 3
Predict — Data-Driven Reliability
By year three, two full years of structured maintenance history exist inside the CMMS, which is exactly what predictive models need to train on. Facilities at this stage shift budget conversations from "what did we spend" to "what did we avoid," using failure prediction to schedule interventions before equipment shows visible symptoms.
Focus: Predictive analytics, capital planning integration, executive reliability dashboards
Milestones and KPI Targets for Each Roadmap Year
A roadmap without measurable targets is just a wish list. The table below sets out the milestone, the KPI that proves it happened, and the software capability that supports it at each stage of a typical three-year facility maintenance strategy program.
| Roadmap Stage |
Primary Milestone |
KPI Target |
OxMaint Capability |
| Year 1, Months 1–3 |
Digital asset register complete for all critical and major equipment |
100% of critical assets identified and tagged |
Mobile asset import, criticality classification, QR asset tagging |
| Year 1, Months 4–9 |
Preventive schedules replace ad-hoc and paper-based maintenance |
Planned maintenance percentage above 60% |
Automated PM generation, mobile work order completion, technician scheduling |
| Year 1, Months 10–12 |
Baseline reliability KPIs established and reported monthly |
MTBF, MTTR, and backlog tracked with no manual spreadsheets |
Real-time dashboards, automated KPI reporting |
| Year 2, Months 1–6 |
Condition monitoring live on top-tier critical assets |
20–30% of critical assets on condition-based triggers |
IoT sensor integration, threshold-based work order automation |
| Year 2, Months 7–12 |
Root cause analysis standardized after every major failure |
Repeat failure rate reduced by 15% or more |
Failure code tracking, root cause workflow templates |
| Year 3 |
Predictive models flag failures ahead of visible symptoms |
Unplanned downtime reduced 20–28% versus Year 1 baseline |
Predictive analytics, capital forecasting, executive dashboards |
Facility Maintenance Strategy · OxMaint · 2026
Your Roadmap Only Works If Your Software Grows With It
OxMaint is built to support all three roadmap years in one platform — asset registers and mobile work orders for Year 1, sensor integration and root cause tracking for Year 2, and predictive analytics for Year 3 — so facility teams never outgrow the system they started with.
The Four Maintenance Maturity Stages Your Roadmap Moves Through
Every facility sits somewhere on a four-stage maturity curve. Knowing exactly where you are today — and being honest about it — is what makes the rest of the roadmap realistic instead of aspirational. The comparison below shows what defines each stage, its typical cost impact, and the data foundation it requires.
Stage 1 — Reactive
TriggerEquipment fails, then someone responds
Cost impactHighest — emergency labor, rush parts, unplanned downtime
Data neededNone to start — this is the default state for most new programs
RiskSafety incidents, compliance gaps, technician burnout
Stage 2 — Preventive
TriggerFixed calendar or runtime-hour intervals
Cost impact20–25% lower than reactive-only programs
Data neededComplete asset register and OEM service intervals
RiskOver-servicing low-use assets, missing developing issues on heavy-use ones
Stage 3 — Condition-Based
TriggerSensor readings cross a defined threshold
Cost impactService performed only when actually needed
Data neededVibration, temperature, or fluid sensors on critical assets
RiskRequires upfront sensor investment and threshold tuning
Stage 4 — Predictive
TriggerAI models flag failures 30 or more days ahead
Cost impactUp to 25% total maintenance cost reduction, 10–20% uptime gain
Data needed12–24 months of clean historical maintenance and sensor data
RiskSkipping straight here without Stage 1–3 data almost always fails
Building Your Roadmap in Four Working Sessions
A roadmap does not need to be a months-long consulting engagement. Most facility teams can produce a working three-year plan in four structured sessions, provided each session has a clear deliverable before the next one starts.
1
Audit the Current State Honestly
Count how many work orders started as an unplanned breakdown versus a scheduled PM over the last twelve months. This single ratio tells you which maturity stage you are actually in, regardless of what the team believes. Most facilities starting this exercise discover they are more reactive than they assumed.
2
Set Baseline KPIs Before Changing Anything
Record current mean time between failures, mean time to repair, planned maintenance percentage, and total maintenance spend before making any process change. Without a true baseline, no future improvement can be proven to leadership or used to justify further investment.
3
Sequence Milestones Year by Year
Assign each maturity stage to a roadmap year using the milestone table above as a starting template, then adjust timing based on your asset count, current staffing, and available budget. Keep each year's goals achievable — an overly ambitious Year 1 is the most common reason roadmaps get abandoned by Year 2.
4
Assign Ownership and a Review Cadence
A roadmap with no named owner decays within a quarter. Assign a single accountable owner per stage, schedule a monthly KPI review, and revisit the full roadmap every six months to adjust for what the data actually shows rather than what was originally assumed.
Expert Perspective
Facility leaders often ask me to help them jump straight to predictive maintenance because that is what gets discussed at conferences. The honest answer is almost always the same — you cannot predict a failure pattern you have never recorded. The facilities that succeed with a three-year roadmap are the ones that treat Year 1 as unglamorous but essential: clean asset data, consistent preventive schedules, and a habit of closing every work order with real information instead of a checkbox. By the time Year 3 arrives, the predictive layer is almost easy to add, because the data foundation has already been doing the hard work for two years. Roadmaps fail when teams skip that foundation to chase the exciting part first.
Priya Raghavan, CMRP
Certified Maintenance and Reliability Professional · 15 years facility and industrial maintenance strategy consulting
Frequently Asked Questions
How long does it take to see results after starting a maintenance roadmap?
Most facilities see planned maintenance percentage improve within the first 60–90 days once work orders and PM schedules move into one system. Measurable downtime and cost reductions typically follow within 6–9 months.
Book a demo to see a realistic timeline for your facility size.
Do we need IoT sensors before we can start a roadmap?
No. Year 1 of a roadmap is built entirely on asset records and preventive scheduling, with no sensors required. Condition monitoring and sensors are introduced in Year 2, once critical assets and baseline data are already established.
What is the biggest reason facility roadmaps fail partway through?
Skipping the foundational data work to chase predictive maintenance too early, and roadmaps with no single accountable owner. Both problems are avoidable with a clear milestone table and a monthly review cadence, as outlined earlier in this guide.
Can a small facility team realistically run a three-year roadmap?
Yes. The roadmap scales down to smaller asset counts and staff sizes just as well as it scales up — the sequence of stabilize, optimize, and predict stays the same, only the timeline per milestone shortens.
Start free to build your own asset register in a single afternoon.
How is roadmap software different from a regular CMMS?
A CMMS logs work orders and assets. Roadmap-capable software also tracks KPI trends over time, supports sensor and condition-based triggers, and provides the dashboards needed to prove each roadmap year's milestones to leadership.
Facility Maintenance Strategy · Roadmap Software · OxMaint
Three Years From Now, Your Facility Will Either Have a Roadmap or Still Be Firefighting
OxMaint gives facility teams the asset registers, mobile work orders, condition monitoring, and predictive dashboards needed to move through every stage of a three-year maintenance strategy roadmap — without switching platforms along the way.