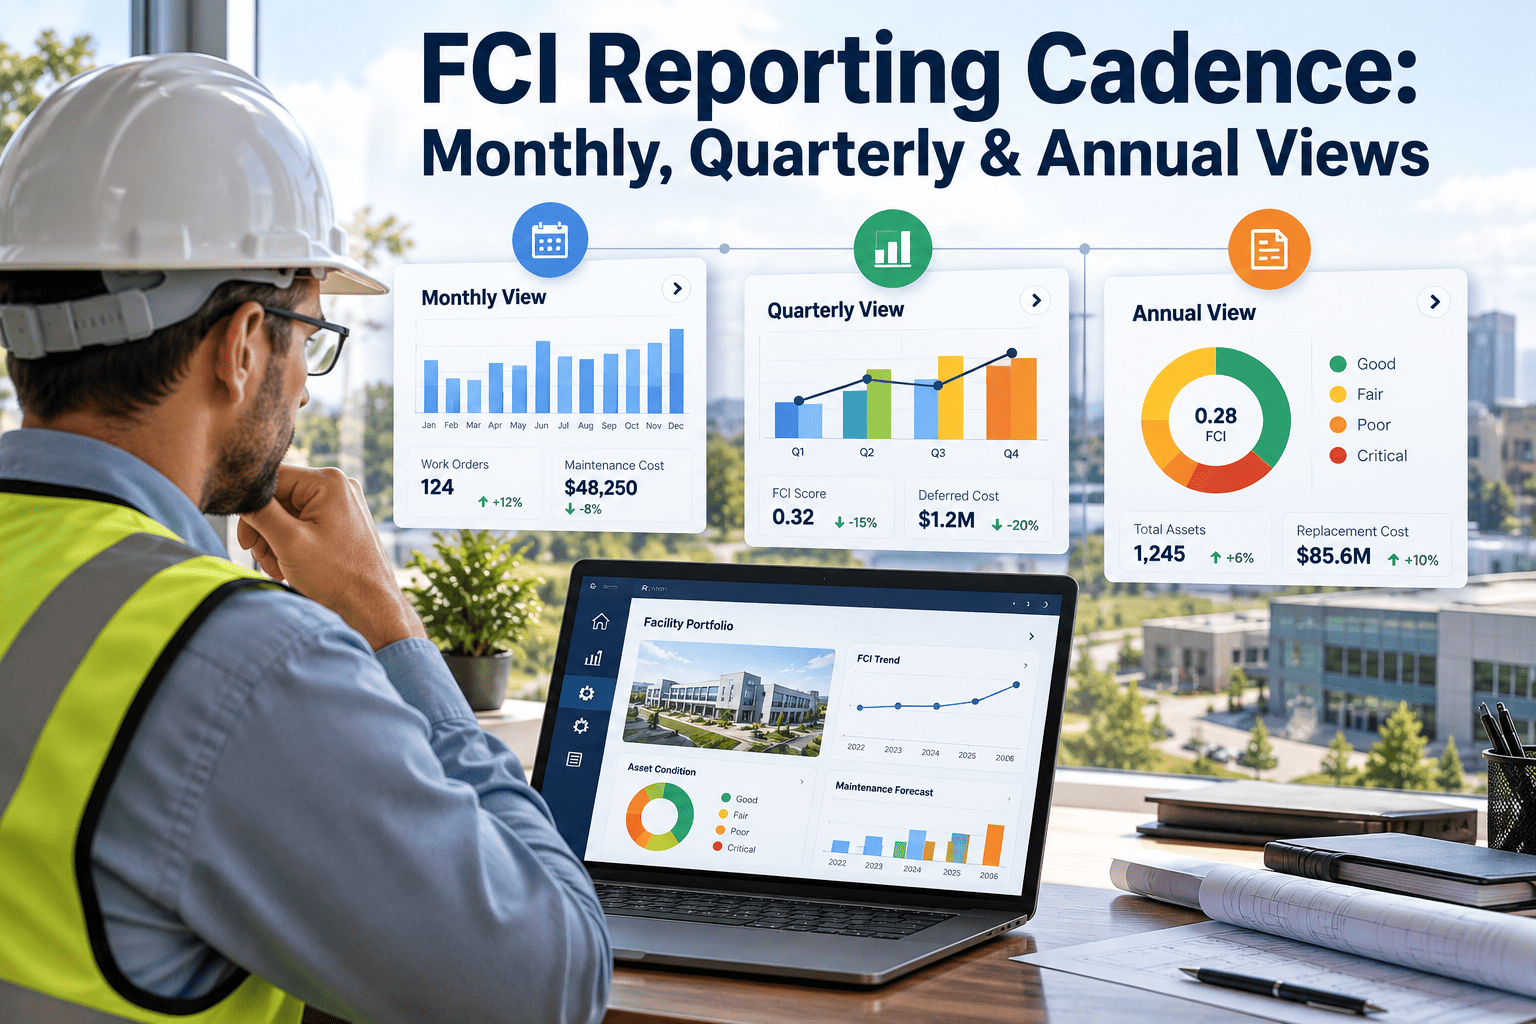
The Facility Condition Index changes slowly, yet many teams report it on the same schedule as everything else. Reported too often, it produces noise and false alarms. Reported only once a year, it produces surprises. A workable FCI reporting cadence gives each period a specific job, a specific audience and a specific set of numbers. This guide lays out monthly, quarterly and annual views for commercial portfolios, and shows how maintenance records in a CMMS feed each one.
FCI Reporting Cadence: Monthly, Quarterly and Annual Views
Match the report to the speed of the data. Watch drivers monthly, judge the trend quarterly and reset the baseline annually.
Why one reporting rhythm does not fit FCI
The ratio has slow and fast parts
FCI compares the cost of deferred maintenance and repair needs against current replacement value. The numerator moves when assessments find new deficiencies, when renewals close old ones and when cost estimates are escalated. The denominator moves when replacement values are updated, usually once a year.
What this means for reporting
If the inputs change in steps rather than daily, a weekly FCI chart mostly shows administrative edits. The useful monthly question is not "what is the ratio" but "are the drivers of the ratio moving the right way".
What actually moves FCI
Who needs which view
| View | Primary audience | Purpose | Decisions it supports |
|---|---|---|---|
| Monthly | FM manager, planners, building engineers | Confirm the work that drives FCI is on track | Crew allocation, deferral of low-risk items, escalation of critical defects |
| Quarterly | FM director, finance, asset management | Judge direction of condition and project delivery | Budget reallocation, project timing, vendor performance |
| Annual | Executives, owners, capital committee or board | Reset the baseline and approve the next capital cycle | Capital funding, financing options, portfolio disposition |
The monthly view: drivers, not the headline ratio
What goes in
- Backlog of open deficiencies by priority and age
- Deficiencies opened versus closed in the month
- PM schedule compliance on critical systems
- Reactive share of labor hours
- Status of funded renewal projects
- Any critical defect with life-safety or shutdown risk
What stays out
- A recalculated FCI when no assessment has changed
- Portfolio averages that hide one failing building
- Long narrative about work already visible in the numbers
- Cost escalation adjustments, which belong to the annual cycle
A simple monthly test
If closed deficiencies exceed new deficiencies for several months running, the quarterly ratio should improve. If not, the monthly report has already told you why.
The quarterly view: trend and delivery
Confirm the plan
Check that projects funded for the year are scoped and scheduled.
Test the trend
Compare FCI by building against the same quarter last year.
Re-forecast
Update year-end FCI and spend forecasts with real delivery data.
Prepare the reset
Assemble evidence for reassessment and next year's capital request.
Contents of the quarterly pack
- FCI by building
- FCI by building system
- Top ten deficiencies by risk
- Spend against plan
- Projects delayed and why
- Forecast to year end
Put condition findings and work history in one place
Oxmaint links assets, inspections, corrective work orders and reports so the drivers behind your FCI are traceable from the monthly view to the building.
The annual view: reset and decide
Reassess
Refresh condition assessments on a rolling basis so no building goes unreviewed for too long.
Update replacement values
Apply an agreed method so the denominator is consistent from year to year.
Escalate costs
Re-price open deficiencies so the backlog reflects current construction costs.
Reconcile the capital plan
Match funded projects to the deficiencies they retire and show what remains.
Set targets
Agree FCI targets by building class with realistic funding behind them.
Signal versus noise: what to expect from each input
| Input | How fast it changes | Where to report it |
|---|---|---|
| Open deficiency count | Daily as work is raised and closed | Monthly |
| PM compliance | Weekly | Monthly, with a quarterly trend |
| Deficiency cost estimates | When reassessed or re-priced | Quarterly and annual |
| FCI by building | Steps after renewals or assessments | Quarterly |
| Replacement value | Annually or with a method change | Annual |
Anatomy of a one-page FCI report
Why decisions go last
Readers accept a report faster when the ask is anchored by evidence on the same page. Keep the requested decision short and tie it to a named building or system.
Data hygiene that makes every cadence trustworthy
Tag every deficiency to an asset
Building-level totals only help when each item rolls up from a specific asset and system.
Use one priority scale
Inconsistent ranking makes backlog comparisons between sites meaningless.
Close work the day it finishes
Late closures inflate the backlog and distort the monthly burn-down.
Version your cost basis
Record the estimate date so escalation can be applied and explained.
Separate repair from renewal
Capital renewal and operating repair need different reporting and funding paths.
Common cadence mistakes
What teams do
- Recalculate FCI every month and explain tiny swings
- Send the same deck to every audience
- Report a portfolio average only
- Change the replacement value method without noting it
What works better
- Track drivers monthly and the ratio quarterly
- Tailor depth to the audience and decision
- Show the worst buildings next to the average
- Document every method change in the annual report
How a CMMS supports the cadence
Capabilities that matter here
Oxmaint maintains the asset register, records inspections that raise corrective work and tracks work orders through completion. Backlog, aging and PM compliance reports provide the monthly drivers, while dashboards help present the quarterly picture.
What it does not replace
Condition assessments, cost estimating and replacement value methods still need engineering and finance judgment. The software organizes the evidence; people decide what it means.
Reports to schedule
Which chart belongs in which report
| Visual | Best cadence | What it answers | Watch out for |
|---|---|---|---|
| Backlog burn-down line | Monthly | Is closed work outpacing new deficiencies? | Mixing capital projects with small repairs on one line |
| Backlog age buckets | Monthly | Are old, high-risk items being left behind? | Averages that hide a few very old critical items |
| FCI trend by building | Quarterly | Which buildings are improving or declining? | Comparing buildings with different assessment dates |
| FCI by building system | Quarterly | Is the problem roofs, plant, envelope or electrical? | Inconsistent system categories between sites |
| Forecast versus target | Quarterly and annual | Will funded work reach the agreed FCI target? | Forecasts that assume full funding without saying so |
| Capital need ranked by risk | Annual | What does the next funding cycle need to cover? | Ranking by cost alone instead of consequence |
Reading a quarterly movement: an illustrative example
The headline says FCI got worse
- Portfolio FCI rose by a small amount since last quarter
- Two buildings were reassessed and found new roof deficiencies
- No renewal projects finished in the period
The drivers explain why
- The rise comes from better information, not sudden decay
- Roof replacement is already scoped for next quarter
- The report states expected improvement once work closes
Lesson for the report author
A ratio can worsen because the team learned more, not because buildings got worse. Always separate movement caused by new findings from movement caused by actual deterioration, and say which it is.
Adapting the cadence for multi-site portfolios
Tier your buildings
Critical sites with high occupancy or life-safety exposure get monthly attention. Lower-risk sites can roll up into the quarterly view.
Stagger reassessments
Reassess a share of the portfolio each year rather than everything at once, so the baseline never goes stale all together.
Standardize definitions
One priority scale, one system list and one cost basis keep site comparisons honest.
Report exceptions first
Lead with the sites outside target and let healthy sites appear in a short summary table.
Allow for different asset ages
A new building and a forty-year-old building should not share one target without context.
Rules for explaining FCI to non-technical readers
Lead with meaning, not method
Say what the ratio implies for risk and cost before describing how it was calculated.
Use one consistent band
Define good, fair and poor once and keep the thresholds fixed in every report.
Pair every number with an action
If a building is in the poor band, state the project, owner and expected date that will move it.
Show the cost of waiting
Describe what happens to the backlog and risk if funding is delayed by a year.
Cadence calendar: who does what and when
Close the books
Planners confirm work orders are closed and deficiencies are coded before the monthly cut-off.
Draft the view
Pull backlog, aging and compliance reports and write a short driver commentary.
Review with finance
Check that project spend, commitments and forecasts match the financial ledger.
Distribute and decide
Send the view to its audience with any decisions requested and a date for each.
Keep the routine short
A monthly cycle that takes a full week of analyst time will eventually be skipped. Automate the data pull, keep commentary to a few lines and spend the saved time on the decisions the report supports.
Targets and thresholds worth agreeing up front
| Measure | What to agree | Review point |
|---|---|---|
| FCI band definitions | Where good, fair and poor begin for each building class | Annual, with changes documented |
| Critical deficiency age limit | Maximum days a safety-related item may stay open | Monthly |
| PM compliance floor | Minimum on critical systems before escalation | Monthly |
| Project delay tolerance | How late a funded project may run before it is flagged | Quarterly |
| Target FCI by building class | Realistic goals tied to the funding actually available | Annual |
Why targets belong in the cadence
Without agreed thresholds, every report reopens the argument about whether a number is acceptable. Written limits let the monthly view flag problems automatically and keep quarterly discussions focused on the response, not the definition.
A good cadence is judged by decisions made, not pages produced. If a report has not changed a schedule, a budget or a priority in the last two cycles, shorten it or change its audience. Review the cadence itself once a year, alongside the baseline reset, and retire any chart that nobody uses.
Frequently asked questions
How often should FCI be reported?
Report the drivers monthly, the ratio by building quarterly and the full baseline annually. FCI itself moves in steps, so more frequent recalculation mostly adds noise.
What should a monthly FCI report contain?
Backlog by priority and age, deficiencies opened versus closed, PM compliance on critical systems and project status. A CMMS like Oxmaint can produce these from work order data.
When should the replacement value be updated?
Usually once a year, using a consistent method. Changing it mid-year creates swings that are unrelated to building condition.
Who should receive the annual FCI report?
Executives, owners and capital committees who decide funding. They need the baseline, the target and what each funding level would achieve.
Can I see these reports before committing?
Yes. You can book a demo to see backlog, aging and compliance reporting using your own reporting needs.
Report FCI at the speed the data actually moves
Give each audience the right view at the right time, backed by maintenance records you can trace. Oxmaint helps facility teams keep that evidence organized.