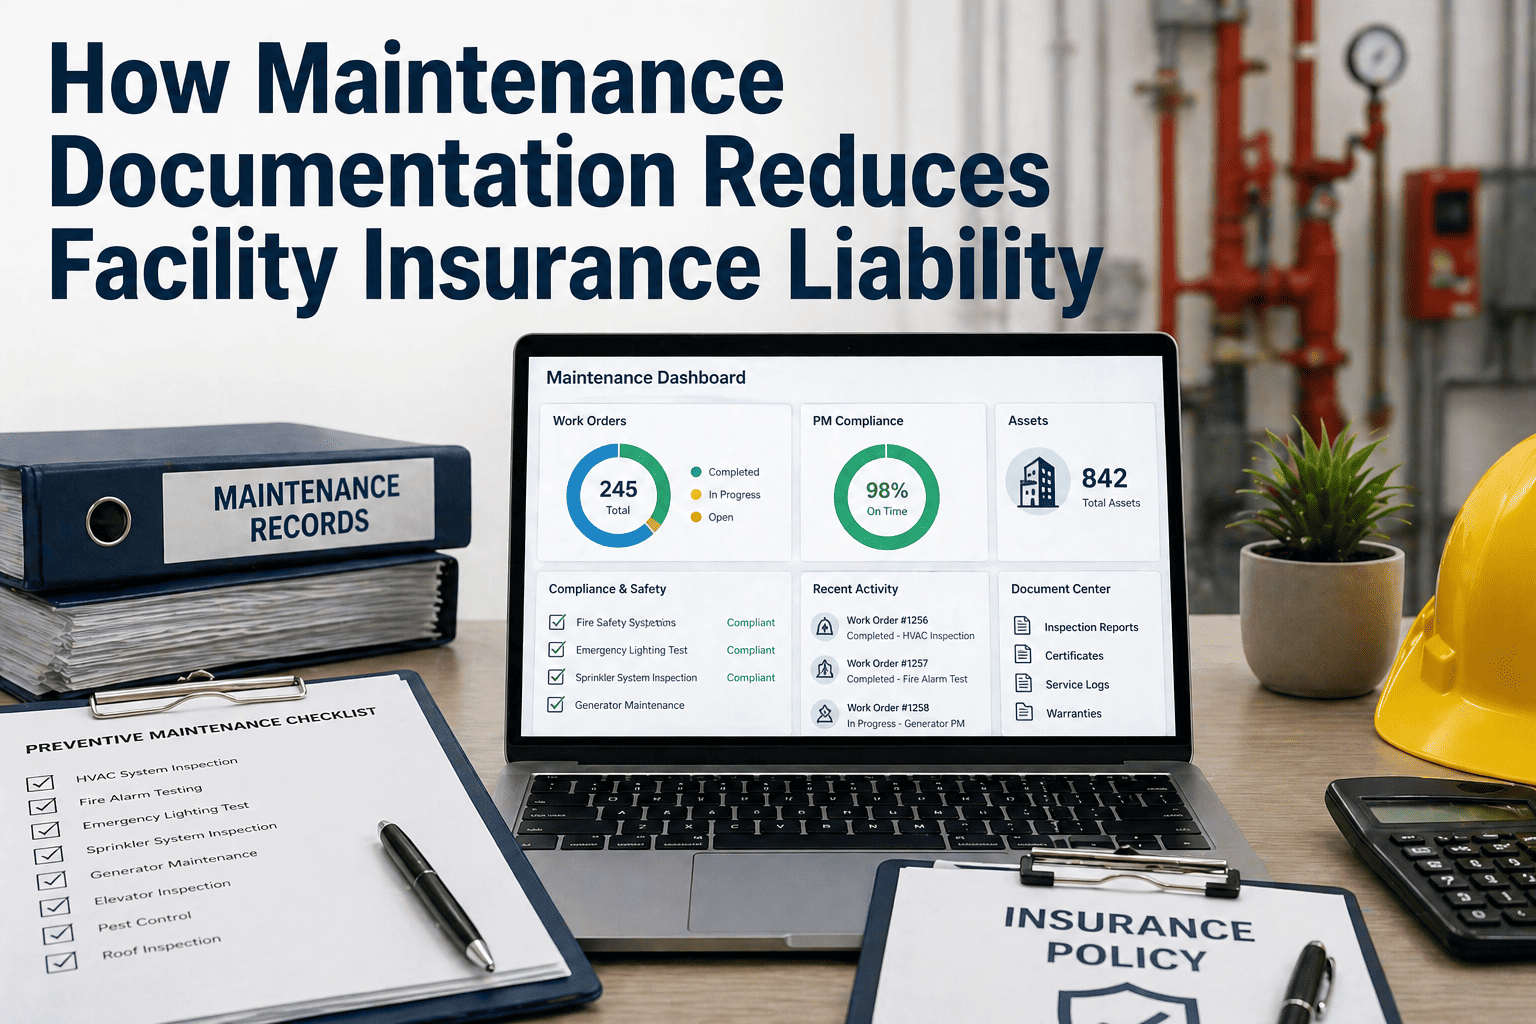
Maintenance teams that operate without centralized KPI dashboards spend an average of 12 hours per week compiling spreadsheet reports manually — pulling data from disconnected work order systems, inventory logs, and technician timesheets. A regional hospital network discovered that its 6-facility maintenance department was reporting MTTR figures 40% higher than actual because spreadsheet formulas referenced stale data exports. After deploying Oxmaint's real-time KPI dashboard, the team reclaimed 50+ hours per month in reporting labor, identified $220K in preventable equipment failures within the first quarter, and achieved 99.1% compliance with Joint Commission documentation standards — all from a single live dashboard that auto-refreshes every 15 minutes.
Why Spreadsheet-Based Maintenance Reporting Fails
Spreadsheet reports snapshot a moment in time — but maintenance operations change by the hour. By the time a weekly KPI report reaches leadership, the MTTR, backlog count, and PM completion numbers are already outdated. Worse, manual data aggregation introduces transcription errors that compound across facilities. Organizations still relying on spreadsheet reporting accept a structural disadvantage that a live CMMS dashboard platform eliminates from day one.
Essential KPIs Every Maintenance Dashboard Must Track
Effective maintenance dashboards surface the metrics that drive decisions — not vanity numbers. The KPIs below represent the core indicators that Oxmaint's dashboard module tracks in real time, each linked directly to the work orders and asset records that generate them.
Tracks the average elapsed time from work order creation to completion across all corrective maintenance tasks. Oxmaint calculates MTTR per asset class, technician, and facility — enabling targeted improvement actions instead of facility-wide averages that mask specific problem areas.
Measures reliability by calculating average operational hours between unplanned breakdowns per asset. Declining MTBF signals that preventive maintenance intervals need adjustment or that an asset is approaching end-of-life replacement — decisions the dashboard surfaces automatically with trend alerts.
Calculates the percentage of scheduled preventive maintenance work orders completed on time versus deferred or overdue. A PM completion rate below 90% correlates directly with increased emergency work orders — the dashboard tracks this weekly and alerts supervisors when completion trends downward.
Quantifies the total planned hours of approved but unexecuted maintenance work, expressed in crew-weeks. A growing backlog indicates resource shortfalls or scheduling inefficiency. Oxmaint's dashboard segments backlog by priority, trade, and aging — showing which work is critical versus deferrable.
Aggregates labor hours, parts costs, and contractor spend per work order with automatic roll-ups by asset, system, and facility. This KPI exposes which assets consume disproportionate maintenance budgets — the repair-versus-replace decision point that spreadsheets cannot surface in real time.
Combines availability, performance, and quality into a single percentage score per production asset. OEE below 65% indicates significant improvement opportunity. The dashboard breaks OEE into its three component losses so maintenance teams can target the specific factor — downtime, speed loss, or defects — dragging performance down.
Dashboard Features That Drive Maintenance Performance
A KPI dashboard is only useful if it connects metrics to action. Oxmaint's reporting module goes beyond static charts — every data point links back to the work orders, assets, and schedules that generated it, enabling maintenance leaders to act on insights directly from the dashboard interface.
Configure daily, weekly, or monthly KPI reports delivered to stakeholder inboxes as PDF snapshots with trend comparisons to the previous reporting period. Leadership sees performance summaries without logging into the system.
Set KPI thresholds that trigger notifications when metrics breach acceptable ranges — PM completion drops below 90%, backlog exceeds 4 weeks, or MTTR on critical assets trends above target. Alerts route to the responsible supervisor with a direct link to the affected work orders.
Organizations managing multiple facilities can benchmark KPIs side by side — comparing MTTR, PM compliance, and cost-per-asset across locations to identify best practices and underperforming sites that need attention.
Drag-and-drop widget placement lets each user configure their own dashboard view. A maintenance director might prioritize budget and backlog widgets, while a planner focuses on scheduling and PM completion — all from the same Oxmaint platform.
How Oxmaint Transforms Maintenance Reporting
Traditional reporting workflows require technicians to close work orders, planners to export data, and managers to build charts. Oxmaint collapses this chain into a continuous, automated pipeline where every work order update instantly reflects on the dashboard.
Oxmaint pulls KPI calculations directly from work order records — no CSV exports, no manual data entry. Every work order created, updated, or closed updates dashboard metrics within 15 minutes. Sign up to connect your maintenance data.
Set facility-specific targets for every tracked metric — MTTR under 4 hours, PM completion above 92%, backlog under 3 crew-weeks. The dashboard color-codes performance against these targets so deviations are immediately visible.
Each stakeholder gets a dashboard configured for their decision scope. Technicians see their assigned work orders and personal productivity metrics. Supervisors see team performance and schedule adherence. Directors see budget, backlog, and cross-facility comparisons.
Click any KPI anomaly to drill into the underlying work orders. Reassign overdue tasks, adjust PM schedules, or approve capital replacement requests — all without leaving the dashboard. Decisions connect to action in the same system.
Replace Spreadsheet Reports with Live Maintenance Intelligence
Oxmaint's KPI dashboard connects directly to your maintenance work orders, asset records, and inventory data — delivering the metrics your team needs to make faster, smarter decisions without manual report building.