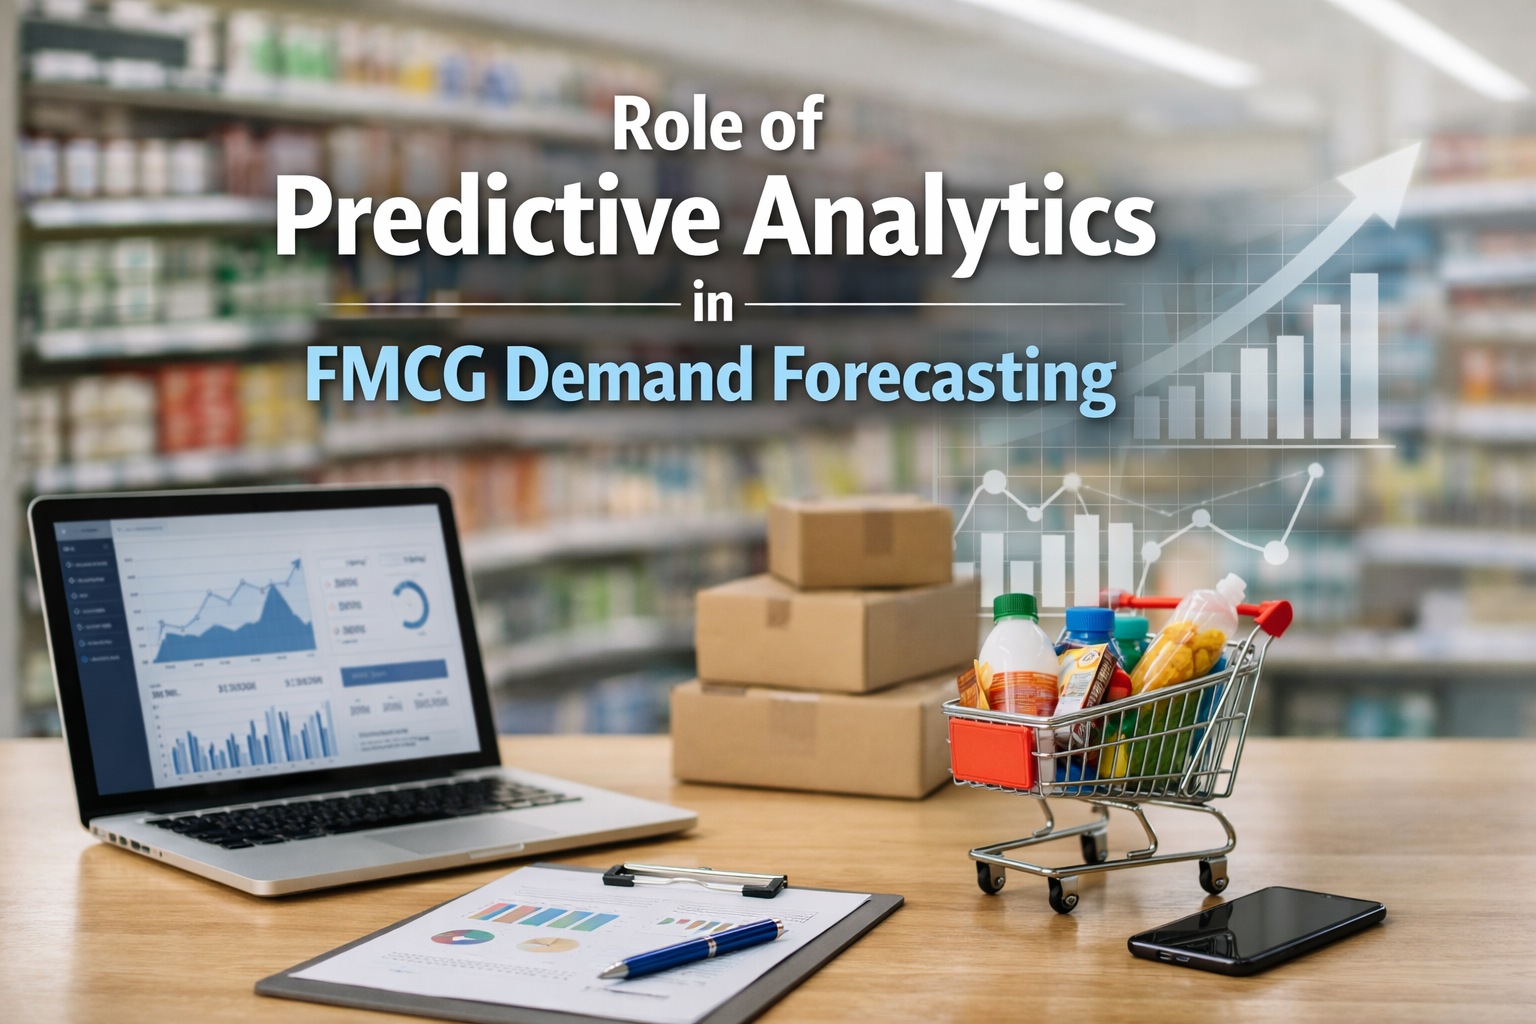
Last quarter's forecast predicted 12,000 units. You produced 12,000 units. Actual demand: 16,500 units. The 4,500-unit stockout cost $81,000 in lost sales and emergency expedited production added $24,000. This quarter, seasonal patterns shifted three weeks earlier than historical data predicted. Yesterday's weather changed consumer behavior. A competitor's promotion altered market dynamics. Traditional forecasting—relying on historical averages and annual patterns—can't handle modern volatility. AI-powered demand forecasting reduces errors 20-50%, cuts product unavailability 65%, and delivers 42% accuracy improvement during market disruptions. The difference: predictive analytics processes millions of data points in real time, integrating POS data, weather, social sentiment, competitor moves, and equipment capacity to forecast what will happen rather than extrapolating what did happen. FMCG manufacturers ready to sign up for predictive platforms connecting production capacity to demand planning can start with OXmaint establishing the equipment reliability foundation accurate forecasting requires.
20-50%
Forecast Error Reduction
AI-powered analytics vs. traditional methods
65%
Product Unavailability Decrease
Better alignment of supply with actual demand
42%
Accuracy Improvement
ML-based demand sensing during volatility
Predictive Analytics Overview: From Reactive to Proactive
Traditional demand forecasting analyzes what happened. Predictive analytics forecasts what will happen. The distinction determines whether manufacturers react to stockouts or prevent them. Traditional methods use historical sales averages, seasonal patterns from prior years, and manual adjustments based on market intuition. Predictive analytics processes real-time POS data, weather forecasts, social media sentiment, economic indicators, competitor activity, promotional impacts, and production capacity constraints simultaneously—identifying patterns humans can't detect and adapting as market conditions change. Manufacturers wanting to schedule a consultation to discuss predictive forecasting implementation can explore how OXmaint's equipment reliability data feeds capacity constraints into demand planning models.
Aspect
Traditional Methods
Predictive Analytics
Data Sources
Historical sales, seasonal patterns
POS, weather, social sentiment, economics, capacity
Update Frequency
Monthly/quarterly reviews
Real-time continuous adaptation
Accuracy
8.5% MAPE (typical)
4-6% MAPE with ML models
Volatility Response
Reactive adjustments after issues
Proactive adaptation to early signals
Capacity Integration
Assumes theoretical production limits
Uses actual equipment availability data
FMCG Use Cases: Where Predictive Analytics Delivers Impact
Predictive analytics transforms multiple FMCG operational domains beyond basic demand numbers. Each use case addresses specific business challenges costing manufacturers revenue and operational efficiency.
Inventory Optimization
Balances stock levels across 1,000s of SKUs and multiple distribution centers, preventing both stockouts and excess inventory that increases holding costs and causes expiration waste.
Impact: 20% inventory cost reduction, minimized waste from perishables, freed working capital
Production Planning
Aligns manufacturing schedules with predicted demand while incorporating equipment reliability data, changeover requirements, and capacity constraints for realistic production plans.
Impact: Reduced emergency runs, optimized changeovers, better labor allocation, 16% excess inventory reduction
Promotional Response
Forecasts demand spikes from marketing campaigns, seasonal events, and competitor actions—enabling proactive inventory positioning and production capacity allocation.
Impact: 30% spike prediction accuracy improvement, eliminated promotional stockouts, maximized campaign ROI
Regional Demand Variation
Identifies geographic demand clusters with distinct patterns, enabling targeted distribution strategies and warehouse positioning that reduce logistics costs and delivery times.
Impact: Optimized distribution networks, reduced transportation costs, improved regional service levels
New Product Launch
Predicts demand for products with limited historical data by analyzing similar product performance, market trends, consumer sentiment, and competitive landscape patterns.
Impact: Reduced launch risk, optimized initial production quantities, faster market penetration
Capacity-Constrained Planning
Integrates equipment reliability data from maintenance systems (like OXmaint) into demand plans, forecasting realistic production capacity based on actual asset conditions rather than theoretical limits.
Impact: Prevented over-commitment, realistic delivery promises, maintenance-aware scheduling
Build Forecasting on Reliable Capacity Data
Predictive demand planning requires accurate production capacity forecasts. OXmaint connects equipment reliability to capacity availability, feeding maintenance-aware constraints into forecasting models.
Data Requirements: Foundation of Accurate Predictions
Predictive analytics quality depends entirely on data quality and breadth. The most sophisticated AI models produce unreliable forecasts when fed incomplete or inaccurate data. FMCG manufacturers implementing predictive analytics need systematic data collection across internal operations and external market signals.
Internal Operational Data
• Historical sales by SKU, location, channel, time period
• Inventory levels and turnover rates
• Production schedules and actual output
• Equipment capacity and reliability (OXmaint)
• Pricing history and promotional calendars
• Quality metrics and defect rates
External Market Signals
• Real-time POS data from retail partners
• Weather forecasts and historical patterns
• Economic indicators (employment, inflation, spending)
• Social media sentiment and trend analysis
• Competitor pricing, promotions, and product launches
• Local events, holidays, and seasonal calendars
Supply Chain Context
• Supplier lead times and reliability
• Transportation costs and delivery times
• Warehouse capacity and utilization
• Distribution center performance metrics
• Raw material availability and pricing
• Production changeover times and costs
Implementation Best Practices
Successful predictive analytics implementation follows systematic approach starting with operational foundations before deploying advanced models. Organizations attempting enterprise-wide AI forecasting without reliable data infrastructure achieve poor results. Manufacturers ready to get started with foundational data systems connecting equipment to capacity establish the operational reliability predictive models require.
1
Establish Data Infrastructure
Connect ERP, CMMS, WMS, quality systems into unified platform. Ensure data accuracy, consistency, and real-time availability before implementing predictive models.
2
Start with High-Impact SKUs
Pilot predictive analytics on top 20% revenue-generating products (ABC analysis). Prove ROI with manageable scope before scaling to full product portfolio.
3
Integrate Equipment Reliability
Feed maintenance system data (OXmaint) into capacity forecasts. Predictive demand planning requires realistic production availability based on actual equipment conditions.
4
Combine Multiple Models
Use ensemble methods combining time series analysis, machine learning, and deep learning. Different models excel at different pattern types; ensembles leverage strengths.
5
Enable Cross-Functional Collaboration
Integrate insights from sales, operations, finance, and maintenance teams. Purely statistical models miss context human expertise provides.
6
Monitor and Refine Continuously
Track forecast accuracy (MAPE), adjust models based on performance, incorporate new data sources. AI systems improve through continuous learning.
ROI Impact: Measurable Business Returns
Predictive analytics delivers returns through improved forecast accuracy translating to operational and financial gains. The 20-50% error reduction and 65% unavailability decrease represent significant revenue protection and cost savings.
20-50%
Forecast Error Reduction
Better demand prediction preventing stockouts and overstock situations
65%
Product Unavailability Decrease
Revenue protection from eliminated stockouts and maintained market share
42%
Volatility Accuracy Gain
ML-based sensing maintaining forecast quality during market disruptions
16%
Excess Inventory Reduction
Lower holding costs, reduced expiration waste, improved cash flow
30%
Planning Cycle Time Decrease
Automated forecasting reducing manual work from weeks to days
8.5%→4%
MAPE Improvement
Machine learning models delivering superior accuracy vs. traditional methods
Start With Operational Reliability Foundations
Predictive demand forecasting requires accurate production capacity data. OXmaint provides equipment reliability and maintenance intelligence feeding realistic capacity constraints into AI forecasting models.
Frequently Asked Questions
How does predictive analytics differ from traditional demand forecasting?
Traditional forecasting extrapolates historical patterns assuming future resembles past—analyzing what happened. Predictive analytics forecasts what will happen by processing real-time data from multiple sources simultaneously: POS transactions, weather patterns, social sentiment, economic indicators, competitor activity, and production capacity constraints. Machine learning models identify patterns humans can't detect and adapt continuously as conditions change. Traditional methods update monthly/quarterly with 8.5% MAPE (mean absolute percentage error). Predictive analytics operates in real-time achieving 4-6% MAPE. This accuracy difference prevents stockouts costing lost sales and excess inventory increasing holding costs.
What data does predictive demand forecasting require?
Accurate forecasting needs three data categories: (1) Internal operations—historical sales by SKU/location/channel, inventory levels, production schedules, equipment capacity from CMMS systems like OXmaint, pricing history, quality metrics, (2) External market signals—real-time POS data, weather forecasts, economic indicators, social media sentiment, competitor pricing/promotions, local events, (3) Supply chain context—supplier lead times, transportation costs, warehouse capacity, raw material availability, changeover times. Data quality matters more than quantity—incomplete or inaccurate data produces unreliable forecasts regardless of model sophistication. Organizations should establish unified data infrastructure before implementing AI models.
How does equipment reliability affect demand forecasting accuracy?
Equipment reliability directly impacts capacity availability—the constraint determining realistic production commitments. Traditional forecasting assumes theoretical equipment capacity (e.g., "Line 3 can produce 10,000 units/day"). Reality: unplanned maintenance reduces actual capacity unpredictably. Predictive forecasting integrating equipment health data from maintenance systems like OXmaint forecasts realistic capacity based on actual asset conditions: upcoming maintenance windows, equipment degradation trends, failure probabilities. This prevents over-committing to demand exceeding achievable production, eliminates surprise capacity shortages disrupting supply chains, and enables maintenance-aware scheduling aligning repairs with demand valleys rather than peak periods.
What's realistic ROI timeline for predictive analytics implementation?
ROI timeline depends on implementation scope and data maturity: (1) Organizations with established data infrastructure see positive returns within 6-9 months from reduced stockouts and excess inventory, (2) Companies needing data system integration first achieve ROI in 12-18 months after infrastructure investment, (3) Pilot programs focusing on high-value SKUs (top 20% revenue) prove value fastest—3-6 months for measurable accuracy improvement. Typical returns: 20-50% forecast error reduction protecting revenue from stockouts, 16% excess inventory decrease freeing working capital, 30% planning cycle time reduction lowering operational costs. Organizations starting with operational foundations (equipment reliability via OXmaint) before advanced forecasting achieve faster, more sustainable returns.
Can small/mid-size FMCG manufacturers benefit from predictive analytics?
Yes—predictive analytics delivers proportional value regardless of company size. Small/mid-size manufacturers face same challenges as large enterprises: demand volatility, inventory balancing, capacity constraints. Implementation approach differs: (1) Start with focused scope—top 20% revenue-generating SKUs rather than entire portfolio, (2) Use cloud-based platforms with subscription pricing rather than enterprise infrastructure investment, (3) Integrate equipment reliability data from accessible CMMS systems like OXmaint providing capacity constraints without complex IT projects, (4) Leverage external forecasting services rather than building internal data science teams. A mid-size manufacturer preventing one major stockout ($50K-$100K impact) and reducing excess inventory 10% ($30K-$80K annual savings) achieves positive ROI from modest predictive analytics investment.