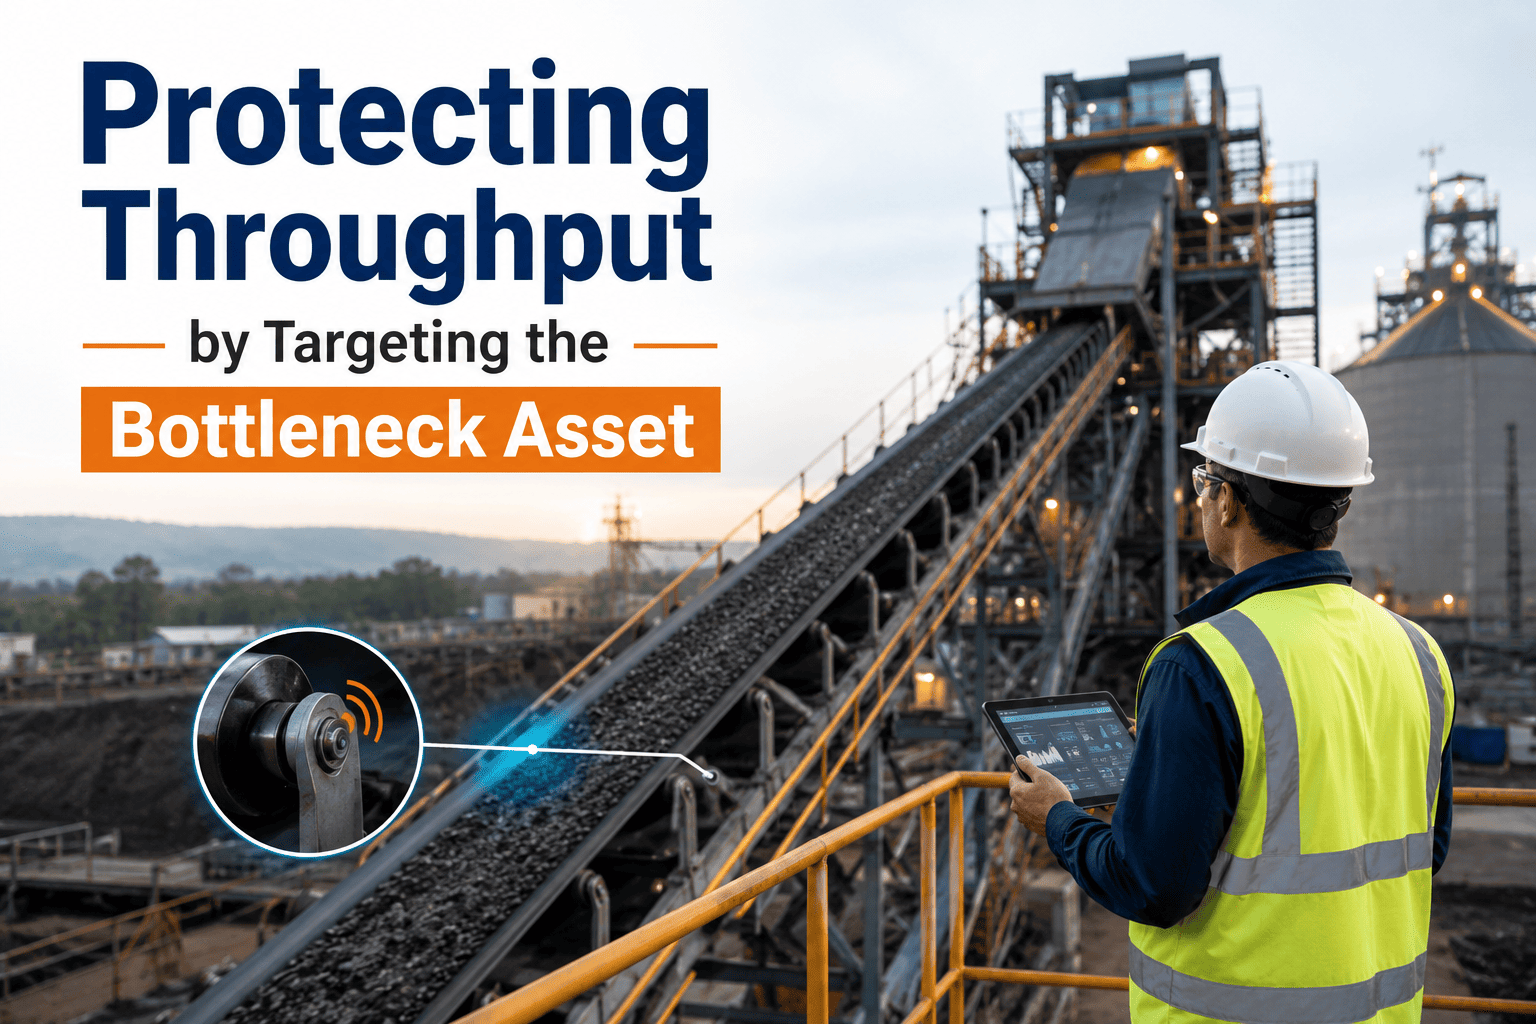
When a food plant chases uptime on every asset equally, maintenance effort gets diluted across machines that have no real bearing on the line's hourly output — while the one constraint that actually sets throughput quietly degrades. The economic logic of Theory of Constraints is unforgiving: a minute lost on the bottleneck is a minute lost forever, and a minute saved on a non-bottleneck is an illusion. This guide lays out a CMMS-driven methodology for identifying the bottleneck asset, prioritizing PM and PdM around it, and protecting the throughput number that actually shows up on the monthly P&L. Ready to put it into practice? Start Free Trial and configure your constraint-first maintenance plan today.
Throughput Guide 2026 · Food Plant Reliability
Is your maintenance budget protecting the one asset that actually sets your line output?
In most food plants, 70–80% of reliability effort lands on assets that don't limit throughput. Refocusing PM, PdM and spares on the bottleneck asset typically recovers 8–15% of lost line output within a single quarter — without adding headcount or capex.
The Constraint Problem
Why calendar-based maintenance leaks throughput every shift
A 180-asset food line running at 72% OEE typically loses 28% of theoretical capacity — but only a fraction of that loss is recoverable without touching the bottleneck. Maintenance applied to non-constraint assets cannot raise throughput; it can only raise local uptime metrics that never reach the P&L.
"
An hour saved on a non-bottleneck machine is worth exactly zero to throughput. An hour saved on the bottleneck is worth the full marginal contribution of the line.
— Theory of Constraints, applied to food manufacturing reliability
Bottleneck Identification Methodology
Four steps to isolate the asset that actually governs line throughput
Most plants misidentify their bottleneck because they look at individual machine uptime instead of flow. The sequence below combines OEE data, WIP accumulation and CMMS work-order history to pinpoint the true constraint — typically within one production cycle of analysis.
Map active production flow
Pull 90 days of SCADA and MES data to build a flow diagram with actual cycle times per station, not nameplate ratings. The bottleneck is rarely where teams assume — it migrates with product mix and shift patterns.
Locate WIP accumulation
Identify where work-in-process stacks up before a station and starves after it. Sustained upstream buffer + downstream starvation is the physical signature of the constraint asset.
Quantify the throughput cost
Calculate marginal throughput value per hour ($/hr) for the line, then multiply by constraint downtime hours. This becomes the business case for concentrated reliability investment.
Validate with CMMS history
Cross-check against 12 months of work orders — MTBF, MTTR, failure modes and PM compliance for the candidate asset. The true bottleneck shows disproportionate reactive maintenance and repeat failures.
Throughput Loss Value (per week)
Constraint Downtime (hrs) × Marginal Line Rate (units/hr) × Contribution Margin ($/unit) = Weekly Throughput Loss ($)
Worked example: 11 hrs downtime × 8,400 units/hr × $1.85 contribution = $170,940/week — a $8.9M annual exposure on a single asset.
Worked Scenario
A 180-asset frozen entrée line refocuses on the true constraint
A mid-tier frozen entrée plant was spending $42K/year on PM labor spread evenly across 180 assets. OEE hovered at 71%. After identifying the continuous freezer discharge conveyor as the true bottleneck (not, as assumed, the filling turret), the plant rebuilt its PM/PdM priority around the constraint.
Before: Calendar-Based PM
- 180 assets on equal PM rotation
- Constraint downtime: 14 hrs/week
- OEE: 71% · Output: 58,800 units/hr
- $42K PM spend, reactive ratio 62%
After: Constraint-Focused PM
- 34% of PM hours reallocated to bottleneck
- Constraint downtime: 6 hrs/week
- OEE: 79% · Output: 65,100 units/hr
- $42K PM spend, reactive ratio 38%
Same maintenance budget. Same headcount. The only change was where reliability effort landed. The plant recovered 10,800 units/hr of line capacity — roughly $9.7M in annual throughput value — by treating the constraint as the asset that deserved disproportionate attention.
CMMS-Driven Reliability Shift
Reprogramming your CMMS to prioritize the constraint asset
A CMMS configured for constraint-first maintenance does three things differently: it tags the bottleneck asset as priority-1 across every module, it weights PM/PdM scheduling toward that asset, and it alerts reliability engineers the moment the constraint's leading indicators drift — before throughput drops.
| CMMS Lever | Calendar-Based (Default) | Constraint-Focused (Target) | Throughput Impact |
|---|---|---|---|
| PM frequency weighting | Equal across all assets | 3–5× density on bottleneck | −40% constraint downtime |
| PdM sensor coverage | Roll out by asset age | Bottleneck instrumented first | 72-hr early fault warning |
| Spare parts criticality | ABC by spend velocity | Constraint parts always in stock | MTTR cut from 4.1 to 1.3 hrs |
| Work-order priority | First-in-first-out | Constraint WO auto-flagged P1 | Response time −55% |
| KPI dashboards | Plant-wide uptime % | Constraint uptime + throughput $ | Decision speed ↑, waste ↓ |
90-Day Implementation Timeline
From bottleneck identification to protected throughput in one quarter
Food plants that follow this sequence typically see measurable throughput recovery inside 60 days and full PM/PdM reconfiguration by day 90. The timeline assumes a CMMS already in place; greenfield deployments add roughly 30 days for asset hierarchy cleanup.
Identify & validate the constraint
Run flow analysis, WIP mapping and CMMS history cross-check. Lock the bottleneck asset with a documented throughput-cost business case.
Tag the asset in the CMMS
Re-prioritize the asset as P1, rebuild PM checklists around its top five failure modes, and instrument it with vibration/thermal sensors for PdM.
Reallocate spares & labor
Stock constraint-critical parts to min/max, route the most experienced tech to bottleneck PMs, and set automated alerts on leading indicators.
Measure & reinforce
Track constraint uptime, throughput $/hr and reactive ratio weekly. Adjust PM intervals based on PdM data — not the calendar.
Stop maintaining assets that don't limit your output.
Configure your CMMS around the bottleneck and watch throughput climb — same budget, same team, different priority.
Frequently Asked Questions
Bottleneck-focused throughput, answered
How do I know which asset is the true bottleneck if our line runs mixed products?
Run a 90-day flow analysis grouping by product family. The bottleneck often shifts with mix — but one asset is the constraint 70%+ of the time. Tag that asset as P1 and review the mix-shift quarterly. If two assets alternate as constraint, instrument both and let the CMMS alert you when the active bottleneck changes.
Won't focusing maintenance on one asset let other machines degrade?
Non-constraint assets still receive PM — just at a frequency matched to their actual failure risk, not the same calendar cycle as the bottleneck. The goal is proportional effort, not neglect. Plants that re-balance typically see non-constraint failure rates stay flat or improve, because PMs become failure-mode-driven instead of generic.
How quickly can we expect throughput to improve after reconfiguring the CMMS?
Most food plants see the first measurable recovery inside 30–45 days — once PM density on the constraint increases and PdM sensors catch the first early-stage fault. Full benefit (8–15% throughput gain) typically lands between days 60 and 90. You can Book a Demo to walk through a tailored timeline for your line.
What if our bottleneck is a process limitation (cook time, chill time) rather than a mechanical asset?
Process constraints still have mechanical components — pumps, valves, heat exchangers, fans — whose reliability governs whether the process hits its rated cycle time. Apply the same constraint-first logic to the sub-assets that determine process throughput. If the process itself is truly undersized, the CMMS data becomes your capex justification.
Does this approach work alongside ISO 55000 and TPM programs?
Yes — it sharpens them. ISO 55000 asks you to manage asset risk against organizational objectives; protecting the bottleneck is the most direct expression of that. TPM's autonomous maintenance still applies to all assets, but focused improvement (Kaizen) should land hardest on the constraint. The CMMS simply operationalizes the priority.
Protect Your Throughput
Put your maintenance where your throughput actually lives.
Join the food plants using OxMaint to concentrate reliability effort on the asset that sets line output — and recover the throughput they were already paying for.
Free 14-day trial · No credit card