Energy is the second-largest operating cost in most food manufacturing facilities — and in most plants, 20 to 35 percent of that spend is being wasted through inefficient refrigeration cycles, unmanaged steam losses, and compressed air leaks that nobody has logged as a maintenance issue. A food plant running $800,000 per year in energy spend typically has $160,000 to $280,000 in recoverable waste sitting in plain sight — invisible because no system is connecting equipment maintenance data to utility consumption. This case study details how one food processing facility reduced energy consumption by 40% in 14 months by using Oxmaint CMMS to track utility data, optimize refrigeration maintenance schedules, and eliminate the steam system losses that were costing them over $90,000 annually. Start a free trial and see how Oxmaint connects maintenance schedules to energy outcomes, or book a demo to walk through the utility optimization dashboard used by food manufacturers across North America.
Case Study · Food Manufacturing · Energy Optimization
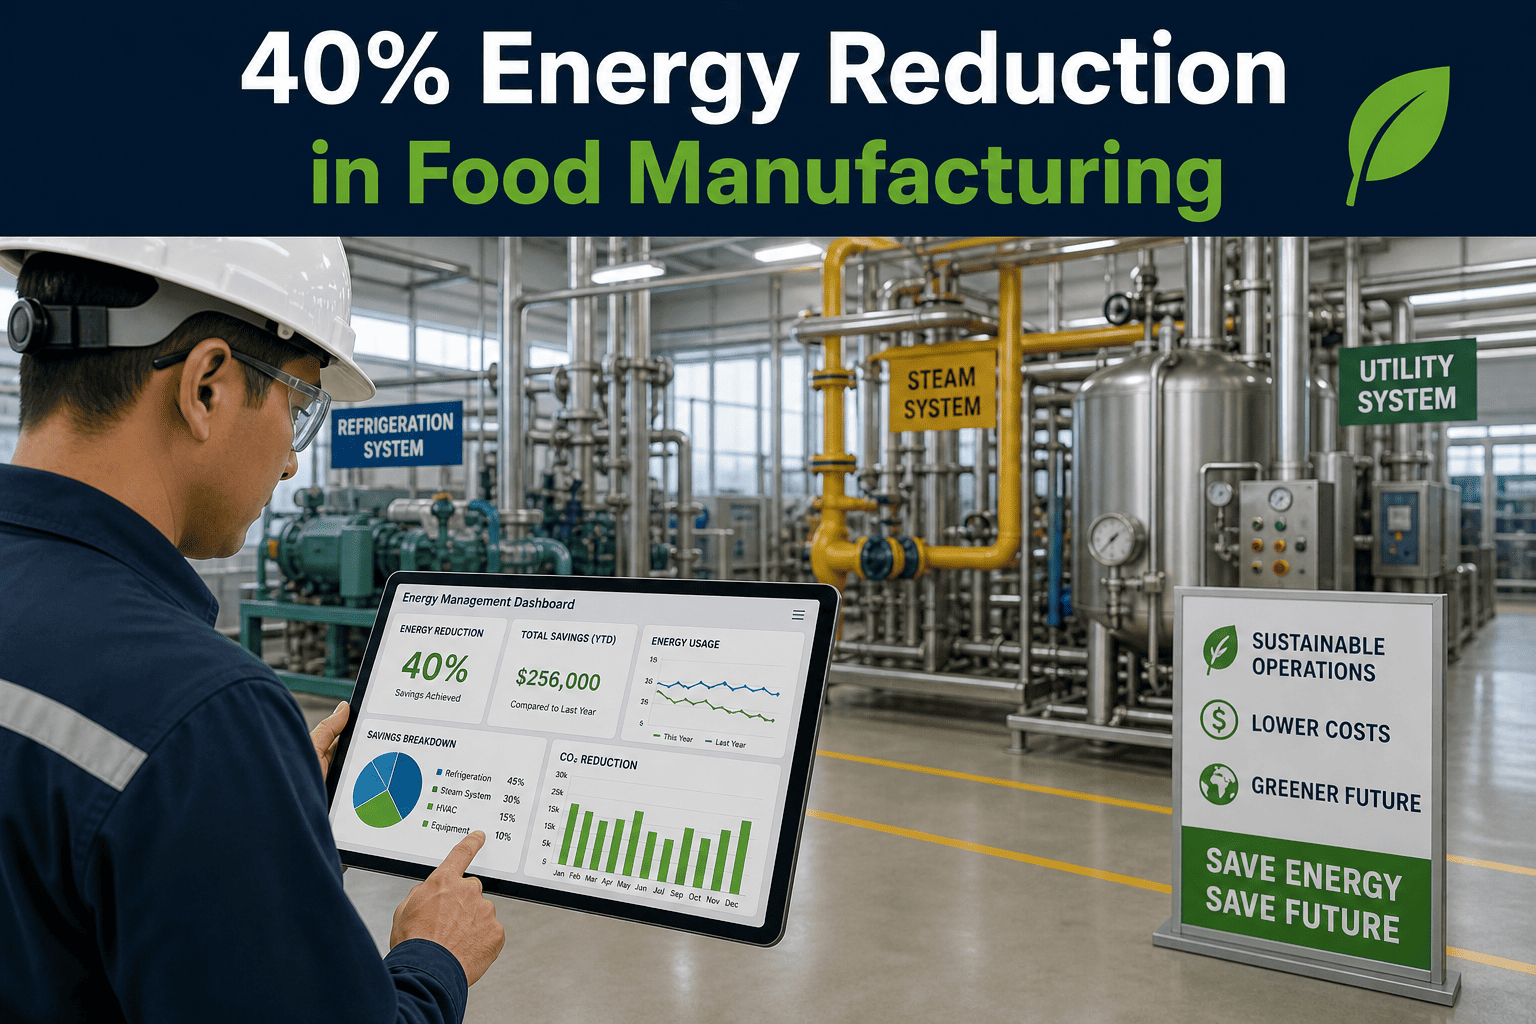
Food Plant Achieves 40% Energy Reduction with CMMS Optimization
A food manufacturing facility reduced energy consumption by 40% in 14 months — using Oxmaint to connect equipment maintenance schedules to utility tracking and eliminate the refrigeration and steam inefficiencies costing them six figures annually.
40%
Total energy consumption reduction in 14 months
$90K+
Annual steam system savings recovered in Year 1
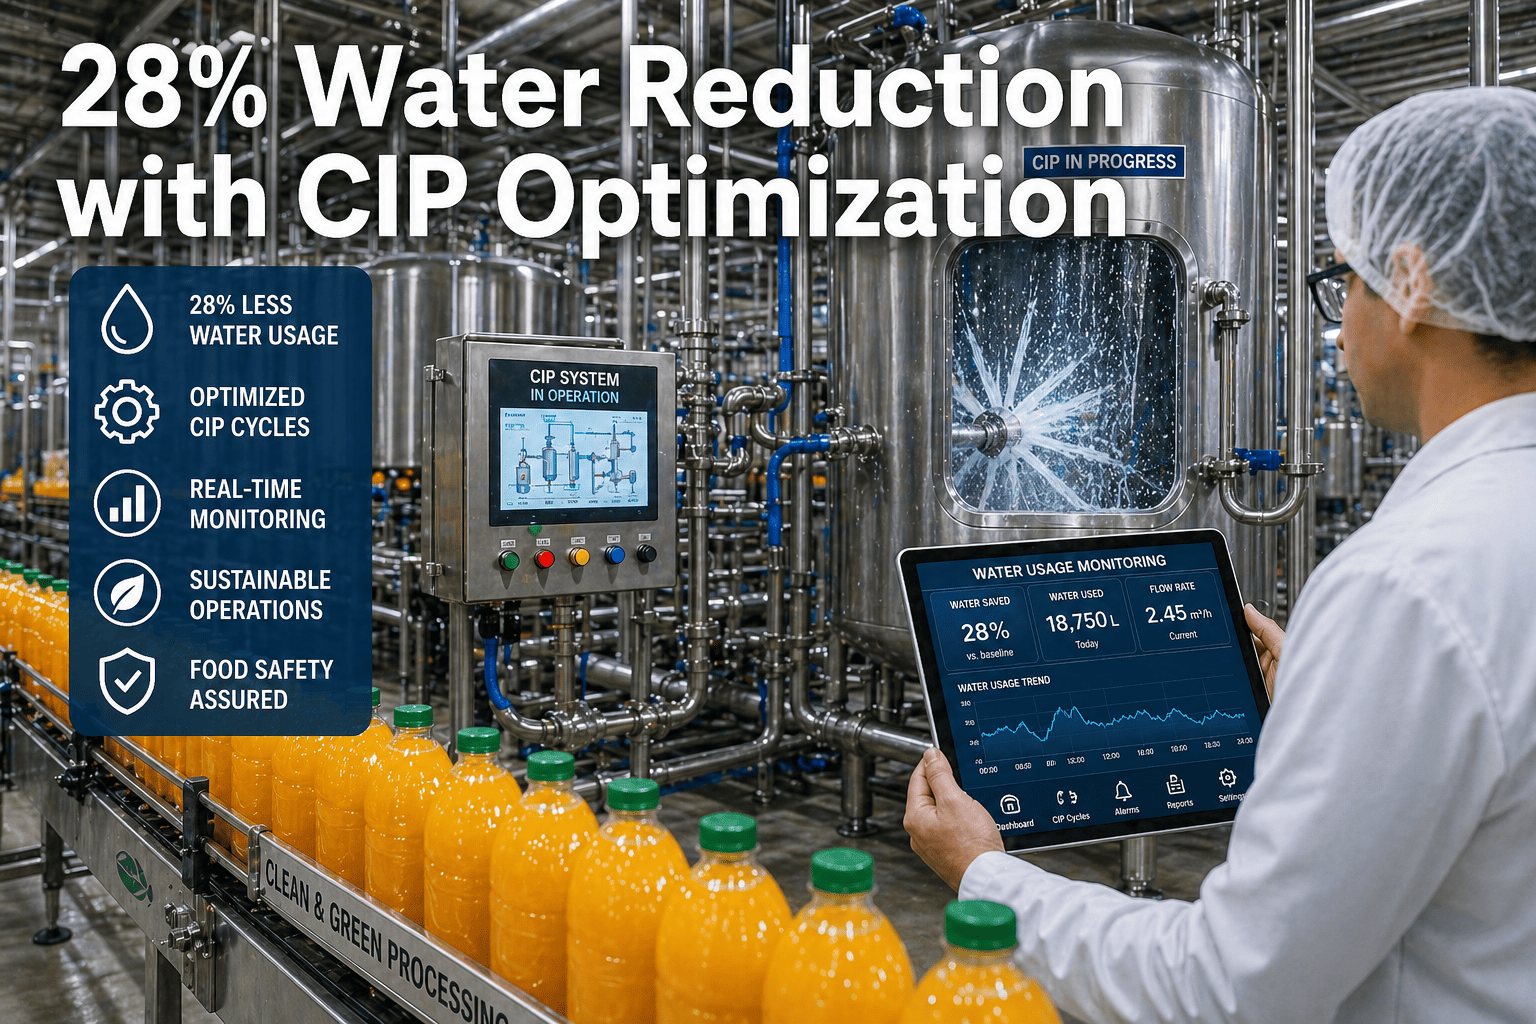
28%
Refrigeration energy reduction from PM schedule optimization
14 mo
Time from CMMS implementation to full 40% energy reduction target
Facility Context
The Energy Profile Before CMMS Optimization
This facility processes ready-to-eat protein products and frozen entrees across four production lines. Annual energy spend was approximately $1.1 million — split between refrigeration (52%), steam and hot water (27%), compressed air (13%), and lighting and HVAC (8%). The maintenance team had no visibility into how equipment condition connected to energy consumption.
Condenser coils were cleaned on a fixed annual schedule regardless of fouling condition. Refrigerant charge was checked only after performance complaints. Steam trap surveys hadn't been conducted in three years — and when they finally were, 34% of steam traps were found to be failed open, venting live steam continuously. Compressed air leaks were not logged as maintenance items.
When the VP of Operations set a 30% energy reduction target tied to an ESG commitment to a major retail customer, the plant manager realized the answer required more than LED retrofits. They needed to see how maintenance decisions were driving energy costs. Oxmaint was the connection point. Start a free trial and see how Oxmaint maps maintenance to utility outcomes, or book a demo to see the full energy optimization dashboard.
Pre-Optimization Energy Waste Sources Found
34% of steam traps failed open — venting live steam continuously across 3 production areas
Ammonia refrigeration system running 18% above design head pressure due to fouled condensers
Blast freezer door seals failing — 4 of 8 doors showing measurable air infiltration
Compressed air system leakage estimated at 31% of total compressed air generated
Insulation gaps on steam distribution lines — 6 identified sections with missing or damaged lagging
Evaporator fan motors running at full speed regardless of cooling load — no variable frequency drives
Energy Loss Categories
Where Food Plants Lose the Most Energy to Maintenance Gaps
01
Refrigeration Efficiency Degradation
A fouled condenser coil increases condensing pressure, which forces the compressor to work harder — a 10% increase in head pressure typically increases compressor energy consumption by 5-8%. Most food plants clean condensers annually. In a high-ambient or dusty environment, fouling significant enough to affect efficiency can occur within 90 days. Condition-based cleaning schedules recover this energy loss.
02
Failed Steam Traps Venting Live Steam
A single failed-open 1/2-inch steam trap at 100 psig can waste over 50,000 lbs of steam per year — representing approximately $5,000-$8,000 in fuel cost annually per trap. A facility with 60 steam traps and a 34% failure rate has 20 failed traps venting continuously. A steam trap survey that hadn't been done in 3 years is not unusual. The cost is invisible unless someone is looking.
03
Refrigerated Space Air Infiltration
A compromised blast freezer door seal allows warm, humid air to infiltrate the refrigerated space — increasing refrigeration load, causing frost buildup on evaporator coils, and forcing more frequent defrost cycles. The energy penalty of one failed freezer door seal can exceed $12,000 annually in additional refrigeration energy, plus the cost of accelerated defrost cycles and evaporator maintenance.
04
Compressed Air System Leakage
Industry benchmarks suggest that compressed air leakage in poorly maintained industrial plants runs 25-40% of total compressed air generated. At $0.25 per 1,000 cubic feet of compressed air, a plant generating 500 CFM continuously with 30% leakage is wasting approximately $20,000 per year in electricity — plus the additional wear on compressors from running at higher duty cycles to compensate.
The Oxmaint Solution
How Oxmaint Connected Maintenance to a 40% Energy Reduction
01
Condition-Based Condenser Cleaning
Condenser cleaning frequency shifted from annual fixed schedule to condition-triggered — based on head pressure differential readings logged at each PM inspection. When head pressure rises above threshold, Oxmaint generates a cleaning work order automatically. Refrigeration energy dropped 28% in the first 12 months.
02
Steam Trap Survey Program
All steam traps registered as individual assets in Oxmaint with quarterly survey work orders. Ultrasonic test results and pass/fail status logged per trap. Failed traps generate immediate corrective work orders. Steam losses were reduced by 78% within 6 months of the survey program launch.
03
Blast Freezer Door Seal PM
Monthly door seal inspections scheduled in Oxmaint with mandatory infrared thermometer readings at the door perimeter. Any thermal signature above threshold triggers a seal replacement work order before infiltration costs accumulate. Four door seals replaced in Month 2 recovered an estimated $48,000 in annual refrigeration cost.
04
Compressed Air Leak Log
Compressed air leaks logged as maintenance work items in Oxmaint during weekly walkdowns. Each leak tagged with location, estimated size, and priority. Total leak volume tracked at the portfolio level — giving the energy manager a real number to report against ESG commitments. Leakage reduced from 31% to under 8% in 9 months.
05
Utility Consumption Tracking Per Asset
Energy meter readings associated with major equipment assets in Oxmaint. Compressor run hours, refrigeration kWh, and steam consumption tracked alongside maintenance history — allowing the team to correlate energy spikes with specific maintenance events and validate savings from each corrective action.
06
ESG Reporting Package
Energy reduction data exported from Oxmaint directly into the quarterly ESG reporting package for the retail customer and investor group. Energy savings, carbon reduction estimates, and maintenance investment documented in a format that satisfies Scope 1 and Scope 2 emission reporting requirements.
Before vs. After
Reactive Energy Management vs. CMMS-Driven Optimization
| Energy System |
Before Oxmaint |
With Oxmaint |
| Condenser cleaning schedule |
Fixed annual — fouling ignored between cycles |
Condition-triggered — based on head pressure differential |
| Steam trap management |
Survey every 3+ years — 34% failure rate undetected |
Quarterly surveys — failure rate below 5%, losses down 78% |
| Blast freezer door seals |
Replaced only after visible failure or complaint |
Monthly infrared inspection — replaced before infiltration costs accumulate |
| Compressed air leak management |
Not tracked — 31% leakage not identified as a cost center |
Weekly leak log — reduced to under 8% in 9 months |
| Energy-to-maintenance correlation |
No connection between maintenance data and utility bills |
Asset-level energy tracking tied to maintenance history |
| ESG reporting capability |
Manual estimation — not credible to auditors or customers |
Data-backed Scope 1 and 2 reporting exported from Oxmaint |
Energy costs that looked fixed are actually maintenance problems waiting to be solved. Start a free trial and see how Oxmaint connects your maintenance program to your utility budget, or book a demo to walk through a food plant energy optimization setup with our team.
40%
Total energy reduction
Achieved across refrigeration, steam, and compressed air systems in 14 months
78%
Steam loss reduction
From quarterly steam trap survey program — saving over $90K annually
28%
Refrigeration energy savings
From condition-based condenser cleaning and freezer seal program
8%
Compressed air leakage rate
Down from 31% — recovered via weekly leak log and corrective program
FAQ
Frequently Asked Questions
Does Oxmaint integrate with energy monitoring systems or smart meters?
Oxmaint supports integration with IoT energy monitoring systems, smart meters, and SCADA platforms via API. For food manufacturing environments, this means sub-meter readings for refrigeration compressors, boiler systems, and compressed air compressors can be associated with specific equipment assets in Oxmaint — allowing the maintenance team to see energy consumption data alongside work order history for each asset. Where real-time integration isn't available, Oxmaint supports manual utility reading entry tied to specific assets, which is sufficient to create the maintenance-to-energy correlation that drives optimization decisions. The platform does not require full IoT integration to deliver energy management value — the PM scheduling, condition-based triggers, and work order tracking alone generate measurable energy reductions when properly configured.
How does condition-based maintenance scheduling work in Oxmaint for refrigeration systems?
Condition-based maintenance in Oxmaint works by setting trigger thresholds for readings that technicians capture during routine PM inspections. For a refrigeration condenser, you configure a head pressure reading field in the inspection template and set a threshold — for example, if discharge pressure exceeds a defined set-point above design condensing pressure. When a technician logs a reading above threshold during their inspection, Oxmaint automatically generates a condenser cleaning work order and assigns it based on your configured routing rules. This shifts from a time-based schedule that may clean when the condenser is fine, to a condition-based schedule that responds to actual fouling — which is what drives the energy savings. The same approach applies to evaporator frost buildup, refrigerant sub-cooling measurements, and any other readings that indicate efficiency degradation before it becomes a breakdown.
Can Oxmaint help document energy savings for ESG reporting to retail customers or investors?
Yes. Oxmaint's reporting module can export energy consumption data, maintenance event history, and corrective action records in formats suitable for ESG reporting packages. For Scope 1 emissions (direct energy consumption from boilers, refrigeration systems using HFC refrigerants), Oxmaint's equipment-level energy tracking provides the baseline and post-improvement data needed to calculate emissions reductions. For Scope 2 emissions (electricity purchased), sub-meter data associated with production equipment provides the activity data your sustainability team needs. Many food manufacturers use Oxmaint's energy tracking data to support CDP reporting, GRI Standard 302 disclosures, and customer-facing sustainability scorecards — particularly retail customers with their own Scope 3 supply chain emissions commitments.
How do I calculate the ROI of energy savings from a CMMS investment?
The starting point is a baseline energy audit of your three largest energy consumers: refrigeration, steam/hot water, and compressed air. Most food manufacturers find 20-35% recoverable waste in these systems through maintenance improvements alone — without capital equipment replacement. To calculate ROI, take your current annual energy spend in each system, apply the recovery percentages identified in the audit, and compare the total recoverable savings to the annual cost of the CMMS platform. For a facility spending $1M annually on energy with 25% recoverable waste, that's $250,000 in annual savings against a CMMS cost that's a fraction of that figure. Oxmaint's implementation team can walk through a rough savings calculation based on your facility's energy profile during a demo — which is why booking a demo is the practical first step for any facility where energy is a significant operating cost.
Energy Optimization — Powered by Oxmaint
Your Energy Bill Is a Maintenance Problem. Oxmaint Is How You Fix It.
Food manufacturers running $500K to $2M in annual energy spend typically have 20-40% in recoverable waste sitting in their refrigeration systems, steam distribution, and compressed air networks. Oxmaint connects your maintenance program to your utility costs — and gives you the data to prove the savings to customers, investors, and ownership.