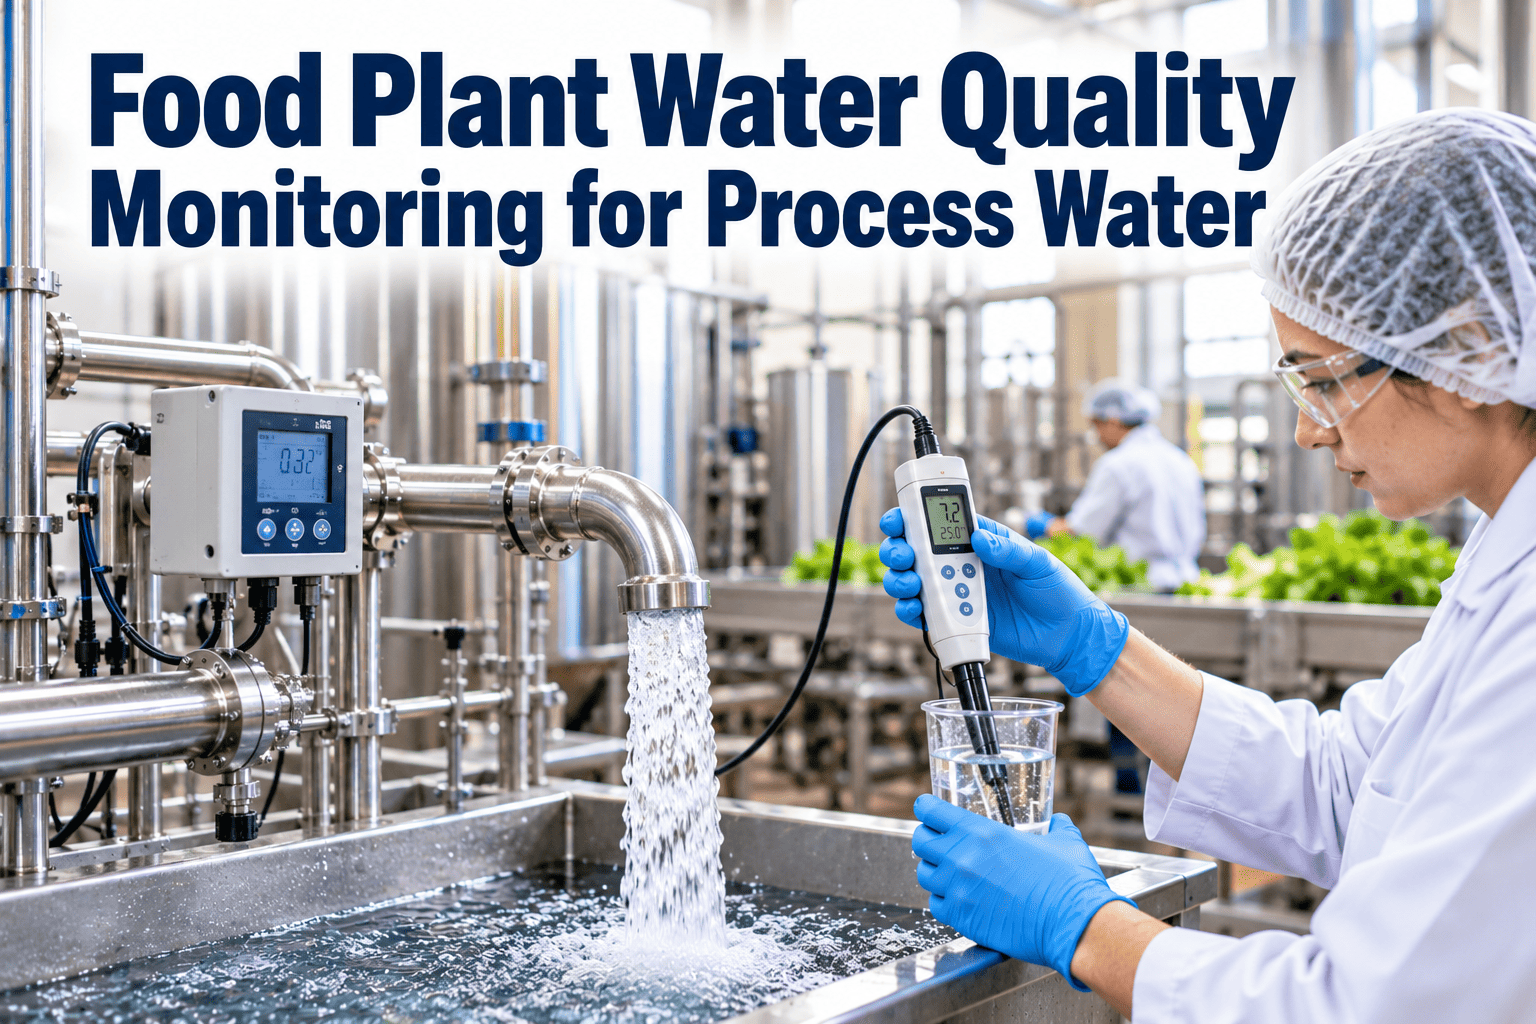
Water touches almost everything in a food plant: ingredients, wash lines, cleaning cycles, steam, cooling and hand sinks. If its quality drifts, the problem spreads quietly into product, sanitation and equipment long before a test result catches it. Food plant water quality monitoring combines sampling, in-line measurement and well-maintained treatment equipment, backed by records that stand up to audits. This guide covers what to measure, where to sample and how a maintenance management system keeps treatment assets and sampling points under control.
Food Plant Water Quality Monitoring for Process Water
Monitor and document process water quality, and maintain the treatment equipment and sampling points that protect product and compliance.
Different uses carry different quality needs
Water that becomes part of the product, or touches it, demands the strictest control. Utility water has different needs but can still cause contamination.
Water that touches food or food surfaces
- Ingredient water for dough, beverages and sauces
- Produce, meat and equipment wash water
- Final rinse after cleaning and sanitizing
- Ice that contacts product
- Steam that contacts food
- Hand wash and utensil water
Water that supports the process
- Boiler feed and non-culinary steam
- Cooling towers and chilled water loops
- Retort and pasteuriser cooling water
- Fire protection systems
- Floor washing and drain flushing
- Cleaning chemical dilution
In the United States, FSMA preventive controls rules require a safe and sanitary water supply, and water that contacts food or food-contact surfaces must be safe and of adequate sanitary quality. Check local drinking water rules for your site too.
Trace risk through every stage of the water system
A result at the tap tells you the end of the story. The stages upstream explain why it changed.
Core parameters for a process water monitoring plan
Choose parameters that match your water source, treatment and product. Set limits in your written plan and local regulations.
| Parameter | Why it matters | How it is checked |
|---|---|---|
| Disinfectant residual (such as free chlorine) | Shows whether disinfection is holding through the system | On-line analyser or handheld test at set points |
| pH | Affects disinfection strength, scaling and corrosion | In-line probe or handheld meter |
| Turbidity | Cloudiness can reduce disinfection and signal filter problems | Turbidity meter at filter outlet and use points |
| Conductivity or total dissolved solids | Signals membrane performance and mineral carry-over | In-line conductivity sensor |
| Hardness | Causes scale in boilers, heat exchangers and nozzles | Titration or test kit after softeners |
| Temperature | Affects microbial growth and cleaning performance | Probes on storage, hot and cold lines |
| Microbiological indicators | Confirm water is microbiologically safe | Laboratory sampling to plan, for example total coliform or E. coli |
| Pressure and flow | Show filter loading, leaks and pump condition | Gauges and flow meters with logged readings |
Design sampling points to represent the whole system
One sample point at the incoming main does not describe what reaches the line. Cover the stages where risk changes.
Entry and treatment
Sample at the incoming supply, after each treatment step and at the treated water outlet. This shows what each stage achieves.
Distribution loop
Sample at far ends, dead-end branches and storage outlets, where residual drops and growth is most likely.
Points of use
Rotate through taps, wash stations, ingredient lines and CIP supplies so every outlet is tested over a cycle.
- Number and label every sampling point, and map it on a plant drawing
- Use sterile bottles, flush the tap first and follow a written sampling technique
- Neutralise disinfectant in microbiological samples where required
- Record time, point, sampler, temperature and in-field readings with each sample
- Use an accredited laboratory where your customers or regulators expect it
Keep treatment equipment and sampling points on schedule
Plan filter changes, instrument checks and sample rounds as recurring tasks with records.
Treatment assets fail in predictable ways
Most water quality excursions trace back to a treatment asset that was overdue for service. Intervals below depend on manufacturer guidance and your water conditions.
| Equipment | Typical failure | Preventive tasks |
|---|---|---|
| Multimedia and carbon filters | Channelling, fouling, media exhaustion | Backwash checks, differential pressure logging, media inspection |
| Water softeners | Resin exhaustion, brine system faults | Hardness testing, regeneration checks, salt level and valve inspection |
| Reverse osmosis systems | Membrane fouling, scaling, seal leaks | Conductivity trending, pre-filter changes, cleaning cycles |
| UV disinfection units | Lamp ageing, fouled quartz sleeves | Lamp hour tracking, sleeve cleaning, intensity checks |
| Chemical dosing systems | Pump wear, blocked injectors, empty tanks | Output verification, tubing replacement, tank level checks |
| Storage tanks | Sediment, damaged vents, stagnation | Scheduled inspection, cleaning and turnover checks |
| Backflow preventers | Failed check valves, relief valve leaks | Periodic testing by qualified personnel, repair records |
| Analyzers and probes | Drift, fouled sensors, expired reagents | Calibration, cleaning and verification against reference tests |
A six-step response to a water quality excursion
Decide in advance who does what. A clear sequence prevents both overreaction and delay.
Detect and confirm
Repeat the reading or retest the sample to rule out a sampling or instrument error.
Contain
Stop using the affected water for critical uses and hold product made since the last good result.
Investigate
Check treatment equipment, recent maintenance, supply changes and sampling method.
Correct
Raise a corrective work order, repair or replace the cause and flush or disinfect as needed.
Verify
Retest at the affected points and confirm results are within limits before release.
Document and review
Record the event, decisions and root cause, then update the plan to prevent repeats.
Steam, ice, CIP and cooling water need their own checks
A general potable water result does not cover every use. Some applications add conditions that must be monitored separately.
| Use | Main concern | Monitoring and maintenance focus |
|---|---|---|
| Culinary steam | Boiler additives and condensate quality reaching food | Approved additives, boiler water checks, steam filters, trap and condensate return inspection |
| Ice | Ice is eaten or contacts product directly | Source water checks, ice machine cleaning, scoop and bin hygiene schedules |
| CIP and final rinse | Residual chemicals or microbes left on equipment | Rinse water conductivity or pH checks, tank cleaning, spray device inspection |
| Cooling towers and chillers | Microbial growth, including Legionella, and scale | Water treatment program, inspection, cleaning and records under a water management plan |
| Cooling of sealed containers | Contaminated cooling water entering seam defects | Disinfectant residual checks and cooling water tank sanitation |
| Hand wash and utensil sinks | Water temperature and supply availability | Temperature checks, tap and aerator cleaning, drain maintenance |
A reading is only as good as the instrument behind it
Drifting probes and expired reagents create false comfort. Put instrument care on the same schedule as the treatment equipment.
Weekly or per-shift routine
- Visual check of probes, flow cells and sample lines
- Cleaning of sensors where fouling is likely
- Review of trend charts for drift or flat readings
- Check of reagent levels and expiry dates
Periodic routine
- Calibration against certified standards
- Comparison of on-line readings with handheld or laboratory tests
- Replacement of consumables such as membranes or electrolytes
- Review of alarm settings and response limits
Record the result of every calibration, including the as-found value. A large as-found error means earlier readings may need review.
Track maintenance signals before water results fail
Laboratory results arrive after the fact. Maintenance data can warn you earlier.
Divide responsibility so nothing is left between teams
Water quality sits between quality assurance, maintenance and sanitation. Written ownership prevents gaps.
Quality and food safety
Owns the sampling plan, limits, laboratory relationship, excursion decisions and product release.
Maintenance and utilities
Owns treatment assets, instruments, piping condition, backflow devices and corrective repairs.
Sanitation and production
Owns hose practices, point-of-use hygiene, drain cleaning and reporting of unusual water conditions.
Protect clean water from the plant environment
Contamination often enters through connections and fittings that nobody thinks of as part of the water system.
What to look for
- Hoses left on the floor or submerged in buckets
- Missing air gaps at drains and tanks
- Unprotected connections to chemical or process lines
- Dead legs left after equipment changes
- Failed or untested backflow devices
What to schedule
- Hose storage rules and regular hose inspection
- Annual or required backflow device testing
- Periodic piping walk-downs against current drawings
- Removal or flushing plan for dead legs
- Drain inspection and cleaning to prevent backup
Keep water records ready for audits and customers
Auditors expect evidence that water is controlled and that problems are corrected. Records should connect results to actions.
- Water source documentation, including municipal reports or well testing results
- Sampling plan, point map, schedule and the results log
- Calibration and verification records for analysers, probes and meters
- Maintenance records for filters, softeners, UV units, dosing systems and tanks
- Backflow testing certificates and repair records
- Excursion records with investigation notes, corrective work orders and retest results
- Contingency plans for supply interruptions and advisories
Requirements vary by country, state, customer and certification scheme. Confirm limits and testing frequencies with your regulator, laboratory and quality team.
Events that should trigger extra testing and inspection
Routine sampling assumes stable conditions. Some events break that assumption and deserve a temporary increase in checks.
- Changes in municipal supply, disinfectant type or reported water quality
- Heavy rain, flooding or seasonal temperature swings that affect source water
- Construction, pipe modifications or new equipment connected to the water system
- Extended shutdowns that leave water standing in tanks and dead legs
- Major maintenance on treatment equipment, tanks or the distribution network
- Any positive microbiological result or customer complaint linked to water
After a long shutdown, flush lines, check disinfectant residuals and review results before restarting production on critical lines.
Know what happens when the supply changes
A boil-water advisory, main break or treatment failure is not the time to write a procedure.
Before
Define decision makers, alternative water sources, bottled or tanked supply options and communication contacts.
During
Stop affected uses, protect product, flush lines and test before returning to normal operation.
After
Sanitise affected equipment, change filters if needed, record the event and review the response.
Water quality and utility cost often share the same root causes
A fouled membrane, a leaking valve or a worn pump hurts quality and wastes energy and water at the same time.
- Rising pump energy can signal blocked filters or scaled heat exchangers
- Frequent membrane cleaning often points to pretreatment problems
- Leaks and running hoses waste treated water and add load to drains and treatment
- Hot water systems running too warm or too cool affect both safety and energy use
- Trending flow, pressure and conductivity helps maintenance fix causes early
- Water meters on major lines make unusual consumption visible, which often points to leaks or valves stuck open
- Combining utility readings with work order history shows which repairs actually improved performance and which did not
Turn water monitoring tasks into scheduled, recorded work
Oxmaint does not analyse samples. It manages the maintenance and inspection work around the water system.
Without a maintenance system
- Filter and lamp changes depend on memory
- Calibration records scattered across files
- Sampling rounds missed when busy
- Excursion fixes not linked to the cause
- Audit evidence assembled at the last minute
With Oxmaint workflows
- Preventive tasks for treatment assets with due dates
- Mobile checklists for sampling and inspection rounds
- Corrective work orders tied to the asset and event
- Spare parts tracking for filters, lamps and membranes
- Reports and history by asset, point and date
Food plant water quality questions
How often should process water be tested?
It depends on source, use and regulation. Set frequencies in your plan and increase them after changes or excursions.
What causes most water quality excursions?
Overdue treatment maintenance, supply changes and cross-connections are common causes. Investigate equipment condition first.
How do I keep treatment equipment on schedule?
Use recurring tasks with due dates and records. Set them up in Oxmaint and track completion.
Should sampling points be maintained too?
Yes. Damaged taps and dirty fittings give misleading results, so inspect and sanitise them on a schedule.
Can Oxmaint store water monitoring records?
It stores work orders, checklists and reports. Book a demo to see how it fits your utilities.
Protect product with water systems you can prove are controlled
Schedule treatment upkeep, capture sampling rounds and keep records ready for the next audit.