Most plants want predictive maintenance and assume they can't have it, because the models they've read about need years of failure data. But a healthy machine rarely fails, so the failure history simply isn't there. Anomaly detection solves this from the other direction: it learns what normal looks like for each machine and flags the day it stops looking normal. No failure library required. OxMaint AI maintenance management software connects that flag to the rest of the workflow, so a drifting asset becomes a tracked work order instead of a chart nobody opens. Sign In to Try Micro App to see asset health and work order history in a working plant.
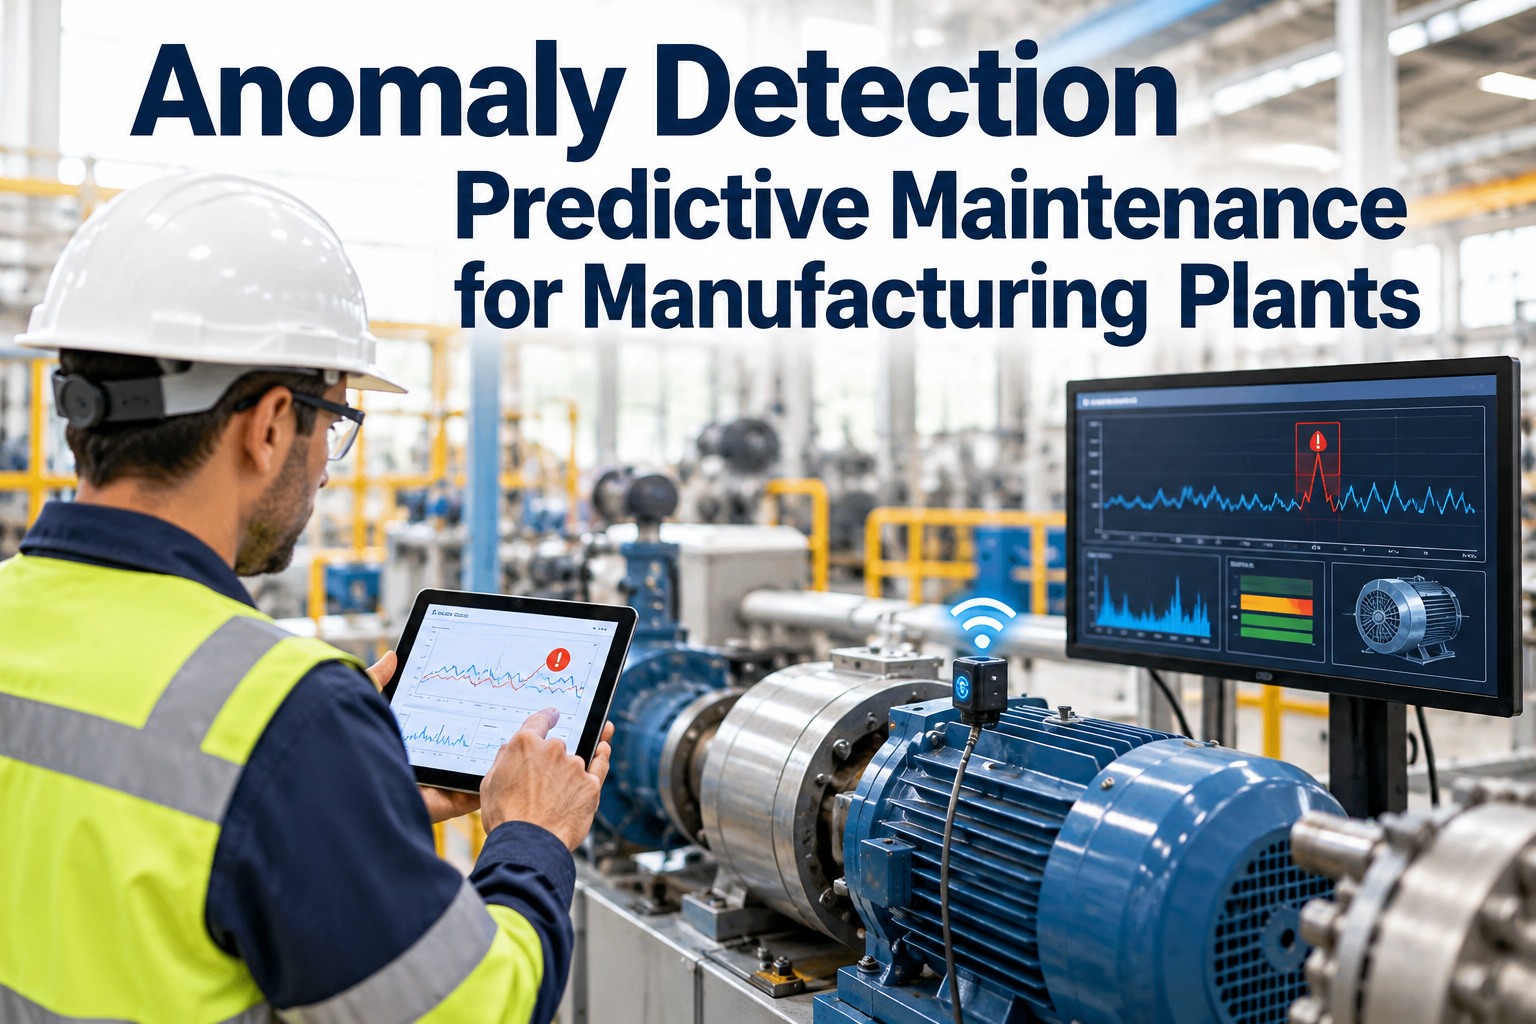
Anomaly Detection Predictive Maintenance for Manufacturing Plants
The usual pain: a bearing runs a little hotter for weeks, nobody has a threshold for it, and the first alarm is the breakdown. Anomaly detection learns each machine's own baseline and scores every new reading against it. Sign in to the micro app and see where that flag lands on a ready-made plant: asset health, work orders and PM schedules already loaded.
The Idea in One Picture
Anomaly detection doesn't ask "is this a known fault?" It asks "is this normal for this machine?" The grey band below is the learned baseline. When the signal leaves it and stays out, the anomaly score rises. Book a demo to see it on your own assets.
Anomaly Detection vs Predictive Maintenance
People treat these as rivals. They aren't: one is a technique, the other is a strategy. Sign In to Try Micro App
Why "No Failure Data" Isn't a Blocker
"We haven't had enough breakdowns to train a model, so predictive maintenance isn't for us."
Unsupervised methods train on normal operating data, which you have plenty of. Research on industrial pumps and presses notes that faulty states are rarely recorded, which is why these methods suit real plants.
From Reading to Score: How a Baseline Works
A baseline is not a single threshold. It's a model of how a machine behaves across load, speed and shift. Book a demo to see baselines per asset.
Reading the Anomaly Score
The score is a prompt for action, not a verdict. Set the response for each band in advance. Get Started with Micro App
Tune band limits per machine. Too many false alerts make teams ignore the system, which is the most common way these programs fail.
Where Condition Already Shows in a Working Plant
The OxMaint AI portal opens on a ready-made metal fabrication and assembly plant: 58 assets, parts and stock, PM schedules and two months of work orders. In the Asset Master, every machine carries a health score, and the KPIs page sums the register up as operational share and average health. A health score is not an anomaly score. It is the shortlist: the machines with the lowest health are the first ones worth baselining.
These are the portal's starting records. Anything you add or change is saved and shared with everyone signed in, so the numbers you see will move. All six machines above are still operational, which is exactly the stage where a drift flag is worth the most. Sign In to Access Micro App
Anomaly Detection Examples From the Plant Floor
The Same Examples, in Real Work Orders
Each example above has a matching job in the demo plant. These are the outcomes an anomaly flag should lead to, and the records that tell you afterwards whether the flag was right.
The Presses column uses a hydraulic shear and a servo alarm from the demo plant, the closest records to press and drive signatures. The plant's Stamping area has 3 assets of its own. Sign In to Try Micro App
Repeat Symptoms: The Labels Your Model Is Missing
Anomaly detection starts without failure labels, but it should not stay that way. Every time the same symptom comes back on the same machine, the work order history is building the labelled examples a model needs. The demo plant already has three machines with a repeat, and one symptom seen on two machines:
A refrigerant alarm raised twice on one chiller is a strong candidate for a baseline: the pattern before the next alarm is what a model learns to spot. Get Started with Micro App
Best Anomaly Detection Algorithms, Compared
There is no single best model. The right one depends on your data and how much explanation operators need. In one 2026 comparison of nine methods on hydraulic pump data, an autoencoder gave the best average result, but simpler methods remain easier to explain. Book a demo to talk through your data.
| Approach | How it works | Best for | Trade-off |
|---|---|---|---|
| Statistical limits | Flags readings beyond normal spread | Single, stable signals | Misses multi-signal patterns |
| Clustering | Flags points far from normal groups | Interpretable baselines | Needs tuning per asset |
| Isolation-based | Isolates rare, unusual readings | Mixed sensor data | Less sensitive to slow drift |
| Autoencoders | Rebuilds normal data; poor rebuild means anomaly | Complex, many-signal machines | Harder to explain, more data |
| Forecasting-based | Predicts next value; flags big misses | Evolving, changing equipment | Needs more setup |
A Flag Is Only Useful If Someone Acts on It.
Many detection projects stall at the dashboard. The demo plant already has repeat alarms on one chiller and repeat leaks on one forklift. Sign in to the micro app and see how every flag can end with an owner, a work order and an outcome you can learn from.
Types of Predictive Maintenance
Start With the Machines That Stop the Line
Baselining every asset at once is how pilots stall. Start where a missed drift costs the most. In the demo plant, 24 of 58 assets are high criticality, meaning failure stops the line, and the downtime already logged shows what late detection costs.
How OxMaint AI Fits the Workflow
Frequently Asked Questions
Catch the Drift. Close the Loop.
Detection finds the problem; maintenance fixes it. Sign in to the micro app, pick the lowest-health machines on a ready-made plant today, and add your own assets when you are ready.