Maintenance reporting and analytics have become the cornerstone of high-performance property management. For property executives, C-suite leaders, and portfolio directors in the US, UK, Canada, Germany, and the UAE, the ability to translate raw maintenance data into actionable board-level intelligence is no longer a competitive advantage — it is a baseline operational expectation. Without structured maintenance reporting, leadership teams are making capital allocation decisions in the dark.
Transform Your Maintenance Data Into Executive Intelligence
OxMaint's Executive AI Briefing Dashboard delivers portfolio-wide KPIs, compliance status, and predictive insights — all in one place, ready for your next board meeting.
What Is Executive Maintenance Reporting?
Executive maintenance reporting is the discipline of aggregating, structuring, and presenting maintenance data in formats that drive strategic decisions at the leadership level. It connects maintenance performance to financial outcomes, risk exposure, and long-term asset value — going far beyond work order logs. For property executives managing multi-site portfolios across the US, UK, Canada, Germany, and the UAE, the challenge is not data scarcity — it is data coherence. A purpose-built Sign Up Free to explore OxMaint consolidates fragmented site-level data into unified portfolio intelligence that leadership teams can act on with confidence.
Why Maintenance Analytics Are a Board-Level Priority
The financial stakes of maintenance performance are substantial. Deferred maintenance erodes asset value. Compliance failures generate regulatory penalties and insurance consequences. Unplanned downtime disrupts tenants and triggers lease disputes. For executives accountable to investors, boards, and regulators, maintenance analytics provide the visibility needed to manage these risks proactively rather than reactively.
Property executives in Canada and the UAE operating rapidly expanding portfolios face particular pressure, as growth outpaces the ability of traditional reporting tools to keep pace. A modern Book a Demo to see it in action scales with portfolio complexity without adding proportional administrative burden.
Core KPIs Every Property Executive Should Track
Effective maintenance reporting begins with defining the right key performance indicators. Not every metric belongs in an executive dashboard — the goal is signal clarity, not data volume. The following KPIs represent the highest-value metrics for property leadership across commercial, residential, and industrial asset classes.
Mean Time to Resolution (MTTR)
Tracks average time from request to resolution — revealing bottlenecks, contractor gaps, and triage effectiveness. In the UK and Germany, MTTR benchmarking directly influences asset valuation and tenant satisfaction scores.
Planned vs. Reactive Maintenance Ratio
World-class facilities maintain a 70:30 planned-to-reactive split. A ratio trending reactive signals deteriorating asset condition and enables targeted capital allocation decisions before financial damage accumulates.
Compliance Completion Rate
Measures mandatory inspections completed on schedule across all jurisdictions — from NFPA 70E in the US to BS 7671 in the UK. A critical KPI for insurance, investor reporting, and portfolio transactions.
Cost per Square Foot / Cost per Unit
Normalizes maintenance spend for meaningful cross-site comparison. Executives in Canada and the UAE use this metric to identify underperforming assets and negotiate contractor rates with evidence-backed leverage.
First-Time Fix Rate (FTFR)
Measures tasks resolved without a return visit. Low FTFR signals diagnostic gaps or parts shortages — inflating costs and degrading tenant experience. Track by contractor and site for objective vendor performance management.
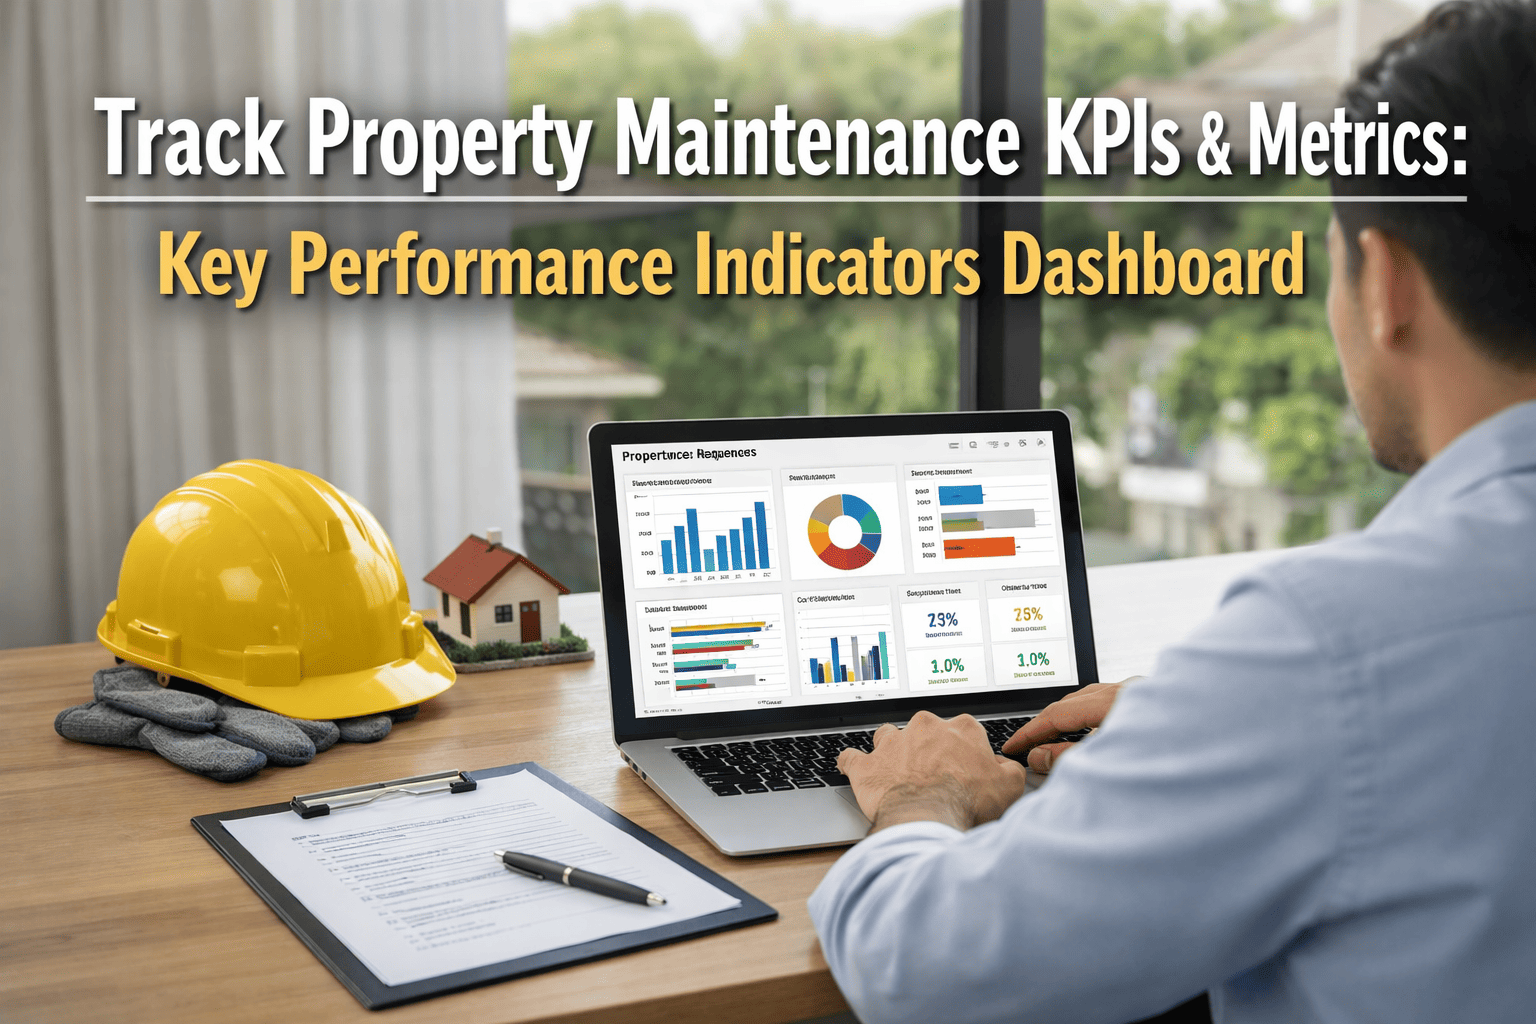
Building an Executive Maintenance Dashboard
An executive maintenance dashboard is not a management-level report with a different name. It is a purpose-designed information environment that gives C-suite and board-level audiences rapid situational awareness across the entire portfolio without requiring navigation through operational detail. The design principles that make a dashboard genuinely useful at the executive level are distinct from those that serve site managers.
Aggregate performance across all sites in a single view — with exception flagging, compliance summaries, and spend trend lines so executives can direct resources without manual report generation.
When a metric flags a concern, drill into site, asset, or category-level data instantly. A well-structured Get Started Free with OxMaint enables root cause identification without analyst support.
Rolling 12-month KPI trend views show where performance is heading — not just where it stands today. Configurable period comparison supports board reporting cycles in the UK, Germany, and UAE.
AI converts dashboard data into plain-language briefings ready for board packs and investor reports — eliminating the preparation bottleneck that delays executive reporting cycles by days.
Maintenance Reporting Frameworks and Formats
Different executive audiences require different reporting formats. Board directors need high-level assurance metrics. CFOs require cost performance and variance analysis. Asset managers demand lifecycle and condition data. A mature maintenance reporting framework serves all these audiences from a single data source — the key is configurable output formatting rather than duplicate reporting systems.
| Report Type | Primary Audience | Key Metrics Included | Recommended Frequency | Format |
|---|---|---|---|---|
| Portfolio Executive Summary | CEO / Board | Health score, compliance rate, major incidents, spend vs. budget | Monthly | One-page PDF / Dashboard |
| Financial Performance Report | CFO / Finance Team | Cost per unit, budget variance, contractor spend, reactive cost ratio | Monthly / Quarterly | Spreadsheet + Narrative |
| Compliance Assurance Report | Legal / Risk / Insurers | Inspection completion rates, outstanding findings, certification status | Quarterly | Audit-ready PDF |
| Asset Condition Report | Asset Managers / Investors | Deferred maintenance backlog, MTTR trends, lifecycle projections | Semi-Annual | Detailed Report |
| Operational KPI Dashboard | COO / Operations Leadership | FTFR, MTTR, planned vs. reactive ratio, open work orders by priority | Real-Time / Weekly | Live Dashboard |
| Contractor Performance Report | Procurement / Operations | FTFR by vendor, response time compliance, cost per task, satisfaction scores | Quarterly | Scorecard |
How AI Vision Enhances Maintenance Reporting & Analytics
AI Vision — computer vision and machine learning applied to visual inspection data — is redefining what property executives can see, predict, and act on. It creates a richer, more objective foundation for executive reporting than manually entered work order data alone.
AI analyzes inspection photos and auto-assigns condition scores based on wear, corrosion, and damage — feeding objective, standardized data directly into executive dashboards across portfolios in Canada, the UK, and the UAE.
AI continuously monitors visual baselines across all sites. New damage or deterioration is flagged automatically — giving property leadership in Germany and the US visibility that previously required expensive on-site audit programs.
By correlating visual condition trends with cost history, AI generates 12–36 month maintenance spend forecasts by site and asset class — turning CapEx planning from estimation into data-driven projection.
OxMaint's AI Briefing Dashboard converts inspection data and compliance status into plain-language executive summaries — ready for board presentation in minutes, with no manual synthesis required.
OxMaint Executive AI Briefing Dashboard: Purpose-Built for Property Leadership
OxMaint's Executive AI Briefing Dashboard is designed from first principles for property executives who need portfolio intelligence, not operational data dumps. It aggregates maintenance performance, compliance status, financial metrics, and condition data from across a portfolio and delivers them in a governance-ready format that supports board reporting, investor communications, and strategic decision-making.
Real-Time Portfolio Health Scoring
Every property in your portfolio receives a continuously updated health score derived from maintenance compliance rates, open defect severity, response time performance, and condition trend data. Portfolio-level health scores give executives and board members a single number that captures operational reality — with full drill-down capability to the underlying data drivers when granularity is required.
AI-Generated Board-Ready Narratives
The platform's AI engine converts performance data into plain-language narrative summaries formatted for board pack inclusion. Monthly and quarterly briefing documents are generated automatically, eliminating the preparation time that traditionally consumes facilities management teams in the days before governance reporting cycles. For property executives in the UK and UAE managing investor-grade assets, this capability directly reduces governance overhead costs.
Configurable KPI Frameworks by Asset Class
Commercial office, retail, industrial, and residential asset classes have materially different maintenance KPI relevance profiles. OxMaint allows executives to configure dashboard views and report templates by asset class, ensuring that the metrics surfaced to leadership are the ones that matter for each property type — rather than applying a one-size-fits-all framework that obscures asset-specific performance signals.
Integrated Compliance and Risk Visibility
Compliance deadlines, outstanding regulatory findings, and certification expiry dates are surfaced alongside operational KPIs in a single integrated view. For portfolios operating across multiple jurisdictions — including NFPA standards in the US, BS 7671 in the UK, and DIN VDE requirements in Germany — consolidated compliance visibility is essential for executive-level risk management and audit readiness. Book a Demo to see compliance tracking live.
Benefits and ROI of Executive-Level Maintenance Analytics
The return on investment from implementing structured executive maintenance reporting extends across financial performance, risk reduction, governance efficiency, and asset value preservation. For property leaders evaluating platform investment, the case is compellingly multidimensional.
Condition-driven predictive analytics produce more accurate long-range CapEx forecasts — improving balance sheet credibility with lenders and investors in UK and German real estate markets.
Real-time compliance tracking escalates overdue inspections before they become enforcement exposures — protecting against fines and legal liability across the US, Canada, and the UAE.
Automated briefing generation cuts reporting prep time by up to 80% — freeing leadership teams from manual consolidation cycles and redirecting capacity toward strategic decisions.
Portfolios with documented preventive maintenance programs achieve higher valuations, better exit multiples, and smoother due diligence — especially in competitive markets across Canada and the UAE.
Common Challenges in Executive Maintenance Reporting
Even organizations committed to data-driven property management encounter structural obstacles that undermine reporting quality. Understanding these challenges — and the solutions that resolve them — is essential for executives building reporting programs that hold up under board scrutiny.
Data Silos Across Sites and Systems
Different sites use different CMMS platforms, spreadsheet formats, or paper-based systems — making portfolio-level rollup manual and error-prone. Deploying a single Sign Up Free standardizes data capture and makes aggregated reporting automatic.
Lagging Indicators Dominating Dashboards
Traditional reports focus on costs already incurred and failures already experienced. Executive dashboards must prioritize leading indicators — backlog growth, condition trajectories, and approaching compliance deadlines — to give leadership the forward visibility needed to intervene early.
Inconsistent KPI Definitions Across Sites
When site teams define MTTR or first-time fix rate differently, portfolio-level averages become misleading. Standardizing KPI definitions through platform configuration — not just policy — enforces consistency across every location in the portfolio.
Board-Level Comprehension of Operational Data
Board members are governance experts, not maintenance specialists. Raw KPI data without narrative context creates comprehension friction. AI-generated executive summaries translate metrics into plain-language business implications — closing the gap without burdening the facilities team.
Best Practices for Executive Maintenance Reporting Programs
Organizations that achieve sustained excellence in maintenance reporting share a set of structural and cultural practices that distinguish their approach from compliance-oriented data summaries.
Align Reporting Cadence to Governance Cycles
Design reports around the organization's governance calendar — board cycles, investor periods, and regulatory deadlines. When cadence aligns with governance needs, maintenance analytics become a standard board input rather than an ad hoc document.
Define a Portfolio Benchmark Set
Raw KPIs are only meaningful against benchmarks. Establish portfolio-specific benchmarks annually and present performance against them in every report. Use BOMA, RICS, and IFMA data for the US, UK, Canada, and Germany markets.
Assign Executive Ownership to Each KPI
Every dashboard KPI needs a named accountable owner at the leadership level. When a metric deteriorates, there is a clear escalation path — especially critical in portfolios with distributed or outsourced facility management.
Integrate Financial and Operational Data
Present MTTR trends alongside reactive cost trends in a single view. When executives see the financial consequence of operational performance, the business case for preventive investment becomes self-evident.
The Strategic Case for Investing in Maintenance Analytics
For property executives evaluating platform investment, the strategic case for maintenance analytics infrastructure is straightforward. The cost of a single compliance enforcement action, an unplanned major system failure, or a deferred maintenance write-down in a portfolio transaction typically exceeds the multi-year cost of a comprehensive analytics platform. The question is not whether the investment is justified — it is whether the organization is prepared to manage the risk of operating without it.
Property leadership teams in the US, UK, Canada, Germany, and the UAE that have made the transition to executive-grade maintenance analytics consistently report improvements not just in operational performance metrics but in board confidence, investor due diligence outcomes, and insurance cost trajectories. The shift from reactive data consumption to proactive analytical governance is the defining strategic upgrade for property executives in this decade.
Ready to Elevate Your Maintenance Reporting to Board Level?
OxMaint's Executive AI Briefing Dashboard gives property leaders the portfolio visibility, compliance assurance, and AI-generated insights needed to lead with confidence — and report with precision.
Frequently Asked Questions
What maintenance KPIs should appear in a board-level report?
Board-level reports should focus on portfolio health scores, compliance completion rates, planned-versus-reactive maintenance ratios, total maintenance spend versus budget, and major incident summaries. These metrics give board members the governance assurance they need without operational detail that belongs at the management level.
How is an executive maintenance dashboard different from a standard CMMS report?
A standard CMMS report presents operational data — work orders, technician assignments, parts usage — for site managers and supervisors. An executive dashboard aggregates that data into portfolio-level performance metrics, trend visualizations, and exception-flagged summaries designed for leadership audiences who need situational awareness, not operational detail.
How often should maintenance reports be presented to executive leadership?
Portfolio-level executive summaries are typically delivered monthly. Quarterly reports provide deeper financial and compliance analysis. Annual reports support strategic planning and investor reporting. Real-time dashboards give executives on-demand visibility between formal reporting cycles — ensuring that critical developments are not delayed until the next scheduled report.
What is predictive maintenance analytics and how does it support executive decisions?
Predictive maintenance analytics uses historical performance data and AI models to forecast future maintenance requirements, failure probabilities, and associated costs. For executives, predictive analytics transforms maintenance budgeting from estimation to evidence-based projection — enabling more accurate CapEx planning, proactive risk management, and earlier intervention before deterioration becomes expensive failure.
Can maintenance analytics platforms integrate with existing property management systems?
Modern maintenance analytics platforms are designed for integration with existing property management, ERP, and financial systems via standard APIs. OxMaint's platform connects with leading property management tools to consolidate operational and financial data in a single executive reporting environment — eliminating the manual consolidation that undermines reporting quality and speed in large portfolios.
How does AI improve the quality of executive maintenance reports?
AI improves executive reporting in three ways: by automating narrative generation that converts metrics into plain-language insights, by applying anomaly detection to surface exceptions that manual review would miss, and by generating predictive forecasts that give forward-looking visibility unavailable from historical reporting alone. The result is more accurate, more comprehensive, and more actionable intelligence delivered faster than traditional reporting processes allow.