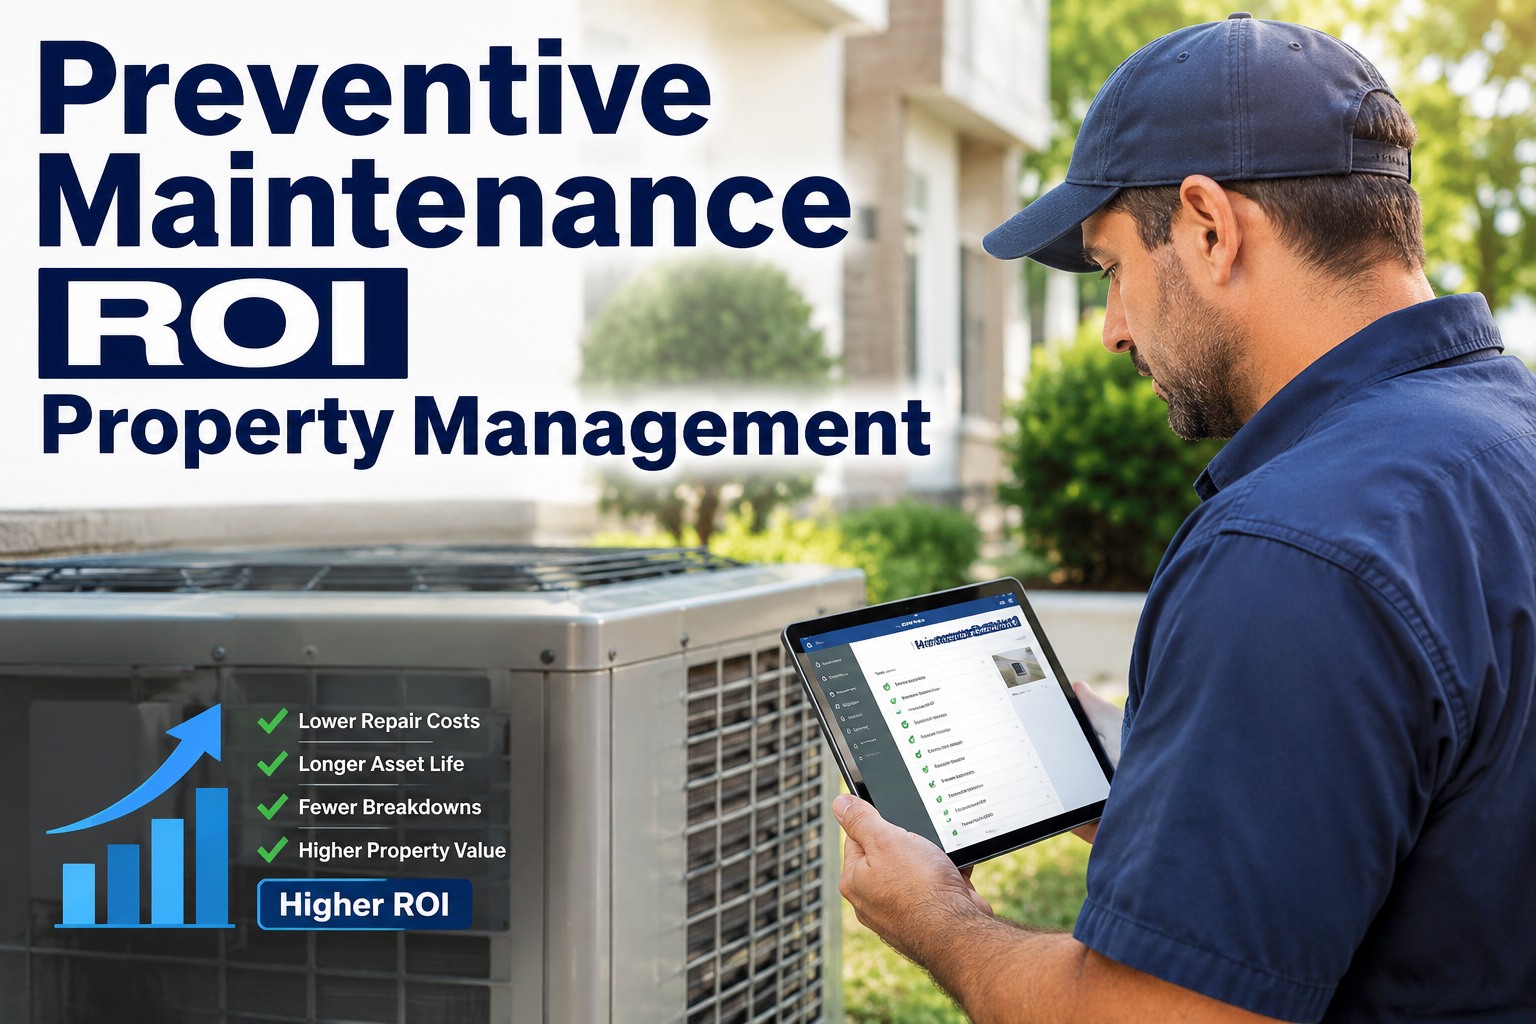
Preventive maintenance ROI for properties is the measurable return you get from scheduled upkeep — fewer emergency repairs, longer asset life, lower operating costs and higher tenant retention — and most well-run programs return $3 to $6 for every $1 spent. The catch: that return is invisible unless you track the reactive cost you're avoiding, not just the PM you're spending. This guide walks through the exact calculation — the reactive cost multipliers, useful-life extension math, retention lift and a spreadsheet-ready model — so you can prove the value of your PM program to owners and asset managers with numbers, not anecdotes. If you want the tracking, scheduling and ROI reporting done for you automatically, Start Free Trial with OxMaint and see your own property maintenance ROI inside two weeks. Below is the full framework.
Every $1 of preventive maintenance avoids $3–$6 of reactive cost. Here's how to prove it.
Reactive repairs cost 3–5x more than planned work, emergency callouts carry 1.5–2x labor premiums, and a documented PM program can extend HVAC and roof asset life by 20–40%. This page gives you the formulas, the benchmarks and the payback model to defend your maintenance budget to any owner.
How do you calculate preventive maintenance ROI for a property?
The formula is simple — the discipline is in what you count. Most property managers under-report ROI because they only count direct repair savings and ignore life extension, retention and energy.
What goes into "avoided reactive cost"
Take every emergency work order from the last 12 months and multiply by the reactive premium: after-hours labor at 1.5–2x, rush parts shipping at +20–50%, water/fire secondary damage, and tenant compensation. A $450 planned HVAC capacitor swap becomes a $1,800 emergency callout with a weekend labor premium — that $1,350 delta is your avoided cost.
What goes into "life-extension value"
Divide replacement cost by expected years of life to get annual depreciation, then multiply by the extra years PM buys. A $7,500 rooftop HVAC unit rated 15 years depreciates $500/yr; if quarterly PM extends it to 19 years, you bank $2,000 of deferred capital per unit. Across 40 units, that's $80,000 of avoided capex.
A real property PM ROI calculation: 120-unit garden complex
A 120-unit property spending $31,000/yr on a structured PM program documented the following returns in year one — a 4.2:1 payback the owner approved for renewal in one meeting.
| ROI Component | How It's Measured | Annual Value |
|---|---|---|
| Emergency repairs avoided | Prior-year emergency spend ($58K) minus current ($24K) | $34,000 |
| HVAC & water-heater life extension | Deferred replacement: 18 assets × avg $1,900/yr depreciation × 3 extra yrs ÷ 3-yr spread | $34,200 |
| Tenant retention lift | Turnover down 9 pts × 11 avoided turns × $2,400 turn cost | $26,400 |
| Energy savings (tuned HVAC, sealed envelopes) | Utility bills down 7% on common + vacant systems | $18,600 |
| Insurance & liability reduction | Premium credit + one avoided slip/water claim | $8,500 |
| Total documented return | Against $31,000 PM program cost | $121,700 · ROI 293% |
Payback period: roughly 3.1 months. Even if you discount the retention and insurance lines by half, ROI stays above 180% — the program defends itself.
Where preventive maintenance savings actually come from
Property maintenance ROI is never one number — it's five stacked value streams. Miss one in your model and you understate the return to ownership.
Reactive cost avoidance
Planned work costs a fraction of emergency work. Industry benchmarks put reactive maintenance at 3–5x the cost of the same task done on schedule — and properties running 80%+ reactive typically overspend their maintenance budget by 25–40%.
Asset life extension
HVAC systems, roofs, water heaters and elevators all carry rated service lives that assume maintenance. Skipping PM shortens life 20–40%; keeping it extends past rating. Deferred replacement is real cash — capex you don't spend this decade.
Tenant retention & rent premium
Maintenance responsiveness is the #1 driver of renewal decisions in resident surveys. Each avoided turnover saves $1,500–$4,000 in vacancy loss, turn costs and leasing fees — and well-maintained properties command 3–7% rent premiums.
Energy & utility savings
Dirty coils, clogged filters and drifting thermostats waste 10–25% of HVAC energy. A tuned, sealed, scheduled building runs measurably cheaper — savings that show up every single month on the utility ledger.
Risk, compliance & insurance
Documented PM on fire systems, elevators, boilers and backflow preventers keeps you code-compliant and audit-ready. Insurers increasingly credit documented programs, and one avoided water-damage or liability claim can pay for a year of software.
See your property's PM ROI before you spend another dollar on emergencies
Book a 30-minute demo and we'll model your portfolio's reactive-vs-preventive cost split live in OxMaint — with your asset list, your work orders, your numbers.
A 6-step spreadsheet model for maintenance ROI in property management
You can build a defensible property maintenance ROI calculator in one afternoon. These six steps turn PM from a line-item expense into a documented investment owners can underwrite.
Baseline your reactive spend
Pull 12 months of work orders. Tag each as planned or reactive. Most properties discover 60–80% of spend is reactive — that's your opportunity pool.
Apply the reactive premium
For each reactive job, estimate what it would have cost planned (divide by 3 as a conservative default). The difference is your avoidable-cost baseline.
Inventory assets & rated lives
List every major asset with replacement cost and rated service life. Compute annual depreciation per asset — this powers the life-extension line.
Set PM schedules & cost them
Assign manufacturer-recommended frequencies (quarterly HVAC, annual roof, monthly life-safety). Total the labor, parts and vendor cost — that's your PM program cost.
Track the shift monthly
Watch the planned:reactive ratio move from 20:80 toward 70:30. Every point of shift converts premium-priced emergencies into scheduled, budgeted work.
Report ROI quarterly to owners
One page: program cost, avoided cost by stream, ratio trend, ROI %. Owners renew what they can see. OxMaint generates this report automatically.
How OxMaint turns property PM into provable ROI
Spreadsheets can model ROI once — OxMaint measures it continuously. Four capabilities do the heavy lifting for property maintenance teams.
Automated PM scheduling
Recurring work orders auto-generate by calendar, meter or season for every unit and asset. Properties typically shift their planned:reactive ratio from 25:75 to 65:35 within six months — the single biggest ROI lever.
Asset registry with life tracking
Every HVAC unit, roof, water heater and elevator lives in one registry with install date, rated life, warranty and full service history — so life-extension value is calculated, not guessed, at budget time.
Cost & ROI analytics dashboards
Per-asset and per-property cost rollups split planned vs reactive automatically. Export an owner-ready ROI report in one click — teams report cutting budget-defense prep from days to minutes.
Compliance & audit trail
Time-stamped completion records, photos and checklists on fire, elevator and life-safety PM keep you inspection-ready and support insurance premium discussions with documented proof of diligence.
Property maintenance ROI benchmarks to sanity-check your numbers
If your calculated ROI falls far outside these ranges, recheck your inputs before presenting to ownership.
"We walked into the ownership meeting with a one-page OxMaint report: $96K of documented avoided cost against $22K of program spend. The budget conversation lasted four minutes. Preventive maintenance stopped being a cost center that day."
Preventive maintenance ROI for properties: common questions
What is a good ROI for a property preventive maintenance program?
A well-run property PM program typically returns 200–400% (a 3:1 to 5:1 ratio) within the first two years, driven by avoided emergency repairs, deferred capital replacement and lower turnover. Anything above 150% comfortably justifies the budget; mature programs with full tracking have documented returns above 500%.
How much more does reactive maintenance cost than preventive?
Reactive repairs cost 3–5x more than the same work done on schedule, once you include after-hours labor premiums (1.5–2x), rush parts, secondary damage and tenant compensation. A $400 planned repair routinely becomes a $1,200–$2,000 emergency — that multiplier is the engine of preventive maintenance ROI.
How long does a PM program take to pay back on a rental property?
Most properties see payback in 3–6 months. The fastest returns come from eliminating emergency callouts on HVAC and plumbing — the two highest-frequency failure categories. Start Free Trial with OxMaint and the planned:reactive dashboard shows your payback trajectory from week one.
How do I prove maintenance ROI to property owners or asset managers?
Present a one-page quarterly report: total PM program cost, avoided reactive spend (tagged work orders), deferred replacement value, retention savings and the resulting ROI percentage. Owners respond to ratios and trends, not anecdotes — a Book a Demo session shows you exactly how OxMaint auto-generates that owner-ready report.
Does preventive maintenance increase property value?
Yes — directly and indirectly. Documented PM extends asset life (reducing near-term capex a buyer would discount), supports 3–7% rent premiums through better condition and retention, and lowers operating expense ratios, which lifts NOI and therefore valuation at any given cap rate. A documented PM history also de-risks due diligence at sale.
Stop defending maintenance as an expense. Start reporting it as an investment.
OxMaint schedules the PM, tracks every dollar of avoided reactive cost, and builds the owner-ready ROI report for you — across one property or a full portfolio.