How to Reduce Commercial Property Maintenance Costs
By allen on March 5, 2026
Commercial property maintenance is one of the largest controllable line items in any real estate budget — yet most owners are overpaying by 20 to 40 percent without realizing it. The fix is not cutting corners. It is cutting waste.
Properties using structured maintenance programs report 18-34% lower annual maintenance spend compared to those relying on reactive-only operations.
Where Your Maintenance Budget Actually Goes
Before cutting costs, you need to know where money is leaking. Most commercial property owners are shocked when they break down their spend.
42%
Emergency and Reactive Repairs
The most expensive type of maintenance — always avoidable with planning
28%
Vendor Overpayment
No volume contracts means paying retail rates on every job
18%
Deferred Maintenance Penalties
Small issues left too long turn into capital replacements
12%
Admin and Reporting Overhead
Manual tracking, phone calls, spreadsheets — all labor that adds up
The Real Cost of Doing Nothing
Reactive maintenance is not just expensive per job — it compounds over time across your entire portfolio.
3x
Higher cost for emergency repairs vs planned preventive maintenance on the same asset
23%
Average asset life reduction when maintenance is deferred beyond manufacturer schedules
$0.18
Saved per square foot annually when switching from reactive to preventive maintenance programs
47%
Of unplanned failures are preventable with routine inspection and scheduled servicing
6 Proven Strategies to Cut Maintenance Costs
These are not theoretical. Each strategy below is applied by high-performing commercial property teams managing costs at scale.
01
Switch to Preventive Maintenance Schedules
Stop waiting for things to break. Scheduled inspections on HVAC, roofing, plumbing, and electrical systems cost a fraction of emergency repair bills.
Typical savings: 15-25% annually
02
Negotiate Portfolio-Level Vendor Contracts
Consolidating vendors across multiple properties unlocks volume pricing. One master agreement beats ten separate on-call relationships every time.
Typical savings: 18-24% on vendor spend
03
Track Asset Life Cycles Proactively
Know when each asset is due for replacement — not when it fails. Planned capital replacements are 40-60% cheaper than emergency replacements under lease pressure.
Typical savings: 30-45% on CapEx surprises
04
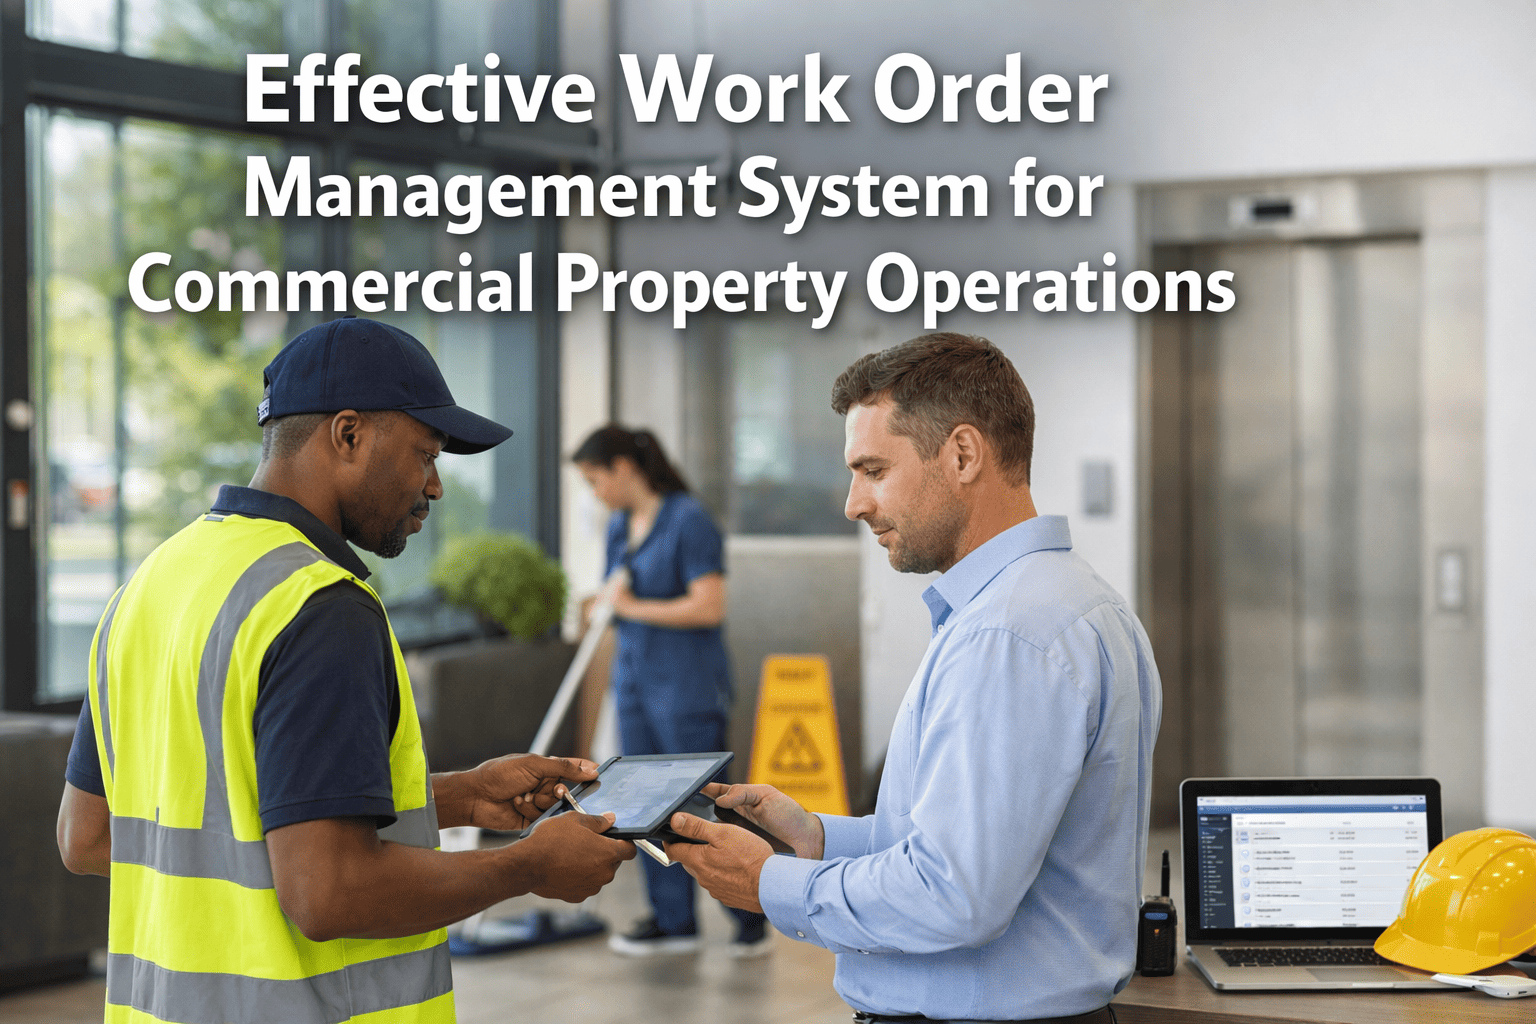
Automate Work Order Routing
Manual coordination wastes hours per week. Automated work order assignment ensures the right vendor gets the right job instantly — with no chasing, no delays, no gaps.
Typical savings: 6-10 staff hours per week
05
Set Spend Thresholds with Approval Controls
Allow site teams to approve routine repairs under a defined limit. Reserve director-level approval for capital decisions. This speeds up small jobs and protects large ones.
Typical savings: 12-18% from budget leakage control
06
Benchmark Costs Across Your Portfolio
If you cannot compare cost-per-square-foot across properties, you cannot manage to a standard. Benchmarking reveals which buildings are underperforming and why.
Typical savings: Identifies 20-35% outlier spend
Preventive vs Reactive: The Cost Reality
Preventive Maintenance
Reactive Maintenance
Average Repair Cost
Planned — 30 to 60% lower
Emergency premium pricing
Asset Lifespan
Extended by 20-40%
Shortened — 23% avg reduction
Tenant Disruption
Minimal — scheduled downtime
High — unplanned outages
Budget Predictability
High — planned spend
Low — constant surprises
Insurance and Liability
Lower risk profile
Higher incident exposure
The ROI of Maintenance Software
The right platform pays for itself. Here is what structured maintenance technology delivers for commercial properties.
Cost Reduction
18-34%
Average reduction in total maintenance spend within 12 months of implementation
Time Saved
8-12 hrs
Per property manager per week — eliminated by automated work orders and reporting
Budget Accuracy
52% less
Budget variance reported by portfolios using standardized maintenance data vs manual tracking
Compliance Rate
91%+
PM schedule completion rate for teams using automated inspection checklists vs 61% manual
Quick Wins Checklist
Not ready for a full overhaul? Start here. These actions reduce costs within 30 to 90 days with minimal disruption.
This Week
Audit your top 10 highest-spend vendors — are you on negotiated rates or retail?
Identify your three most frequently repaired assets and schedule an inspection
Set a documented spend threshold for site-level approval vs. director approval
This Month
Build or review your preventive maintenance schedule for HVAC, roofing, and plumbing
Pull 12 months of work order history and categorize reactive vs. planned work
Consolidate vendor list and contact top vendors about portfolio-level agreements
Frequently Asked Questions
How much can I realistically save by switching to preventive maintenance?
Most commercial properties see 15 to 34 percent reduction in total maintenance spend within the first year of shifting from reactive to scheduled preventive maintenance. The biggest savings come from HVAC systems, roofing, and mechanical assets — all of which are significantly cheaper to maintain on a schedule than to repair in an emergency. Portfolios with five or more properties compound these savings through shared vendor pricing and standardized inspection protocols.
What is the fastest way to reduce maintenance costs without a large investment?
The fastest lever is vendor consolidation. Most properties are paying spot rates to multiple vendors with no volume leverage. Contacting your top five vendors about a multi-property or annual agreement can reduce those costs by 15 to 20 percent within weeks — with no technology change required. The second fastest lever is setting spend thresholds that prevent unapproved overruns on routine work orders.
Is maintenance software worth it for a small portfolio of 3 to 5 properties?
Yes — especially for tracking deferred maintenance and vendor performance. Even small portfolios benefit from having a single record of asset history, work order completion rates, and cost per property. Without a platform, these details live in emails, spreadsheets, and individual memory — making cost analysis nearly impossible. Modern maintenance platforms are priced for portfolios of all sizes and typically pay back within the first year through reduced emergency call-out costs alone.
How do I justify a maintenance software investment to ownership or investors?
Lead with the data gap. Investors and ownership groups need accurate, consistent maintenance cost data to model NOI, plan capital reserves, and value assets. Portfolios without centralized maintenance records consistently underestimate deferred liability and overpay for reactive repairs. A maintenance platform closes that gap and typically produces investor-grade reporting that would otherwise require significant manual effort to compile each quarter.
What Maintenance Actually Costs by Asset Type
Not all systems bleed budget equally. These are the five highest-cost maintenance categories in commercial properties — and the savings available when they are managed proactively.
HVAC Systems
Reactive avg: $4,200/unit
Preventive avg: $680/unit
84% savings potential
Roofing
Reactive avg: $18,500/repair
Preventive avg: $1,200/yr
93% savings potential
Plumbing
Reactive avg: $3,100/incident
Preventive avg: $420/yr
86% savings potential
Electrical
Reactive avg: $5,800/incident
Preventive avg: $850/yr
85% savings potential
Elevators / Access
Reactive avg: $9,400/repair
Preventive avg: $2,100/yr
77% savings potential
Industry Benchmarks: Cost Per Square Foot by Property Type
How does your building stack up? These are the accepted annual maintenance cost benchmarks for commercial properties. If you are paying above these figures, you have a process problem — not a cost problem.
Property Type
Well-Managed
Industry Avg
Reactive / Unmanaged
Class A Office
$2.10 – $2.80 / sqft
$3.40 / sqft
$4.80+ / sqft
Retail Strip / Mall
$1.80 – $2.40 / sqft
$2.90 / sqft
$4.10+ / sqft
Industrial / Warehouse
$0.60 – $0.90 / sqft
$1.20 / sqft
$2.00+ / sqft
Multi-Family Residential
$0.90 – $1.30 / sqft
$1.70 / sqft
$2.80+ / sqft
Medical / Healthcare
$3.20 – $4.10 / sqft
$5.30 / sqft
$7.60+ / sqft
Signs You Are Overspending on Maintenance
Most teams do not know they have a cost problem until they compare. These are the clearest warning signs that your maintenance spend is out of control.
More than 40% of your work orders are unplanned emergency calls
You cannot tell ownership the maintenance cost per square foot without building a spreadsheet
The same vendors send invoices that vary 30% or more for the same type of job
Your HVAC or roofing assets have no documented service history older than 2 years
Your annual maintenance budget has exceeded projections two or more years in a row
Tenant complaints about repeat issues that have been repaired more than twice in 12 months
The Maintenance Cost Maturity Curve
Most property operations fall somewhere on this scale. Where you sit today determines how much cost reduction is available to you.
1
Reactive Only
Fix it when it breaks. No schedules, no records. Highest cost, most surprises.
Cost index: 100%
2
Basic Scheduling
Some PM tasks on calendar. Still mostly reactive. Partial records in spreadsheets.
Cost index: 78%
3
Structured PM Program
All critical assets on scheduled maintenance. Work orders tracked. Vendor SLAs defined.
Cost index: 61%
4
Data-Driven Operations
Benchmarking, asset lifecycle tracking, automated reporting, and CapEx forecasting built in.
Cost index: 66%
Cut Maintenance Costs Across Your Entire Portfolio
Oxmaint gives commercial property teams the tools to shift from reactive to preventive — with automated work orders, vendor management, asset tracking, and portfolio-wide cost benchmarking in one platform.