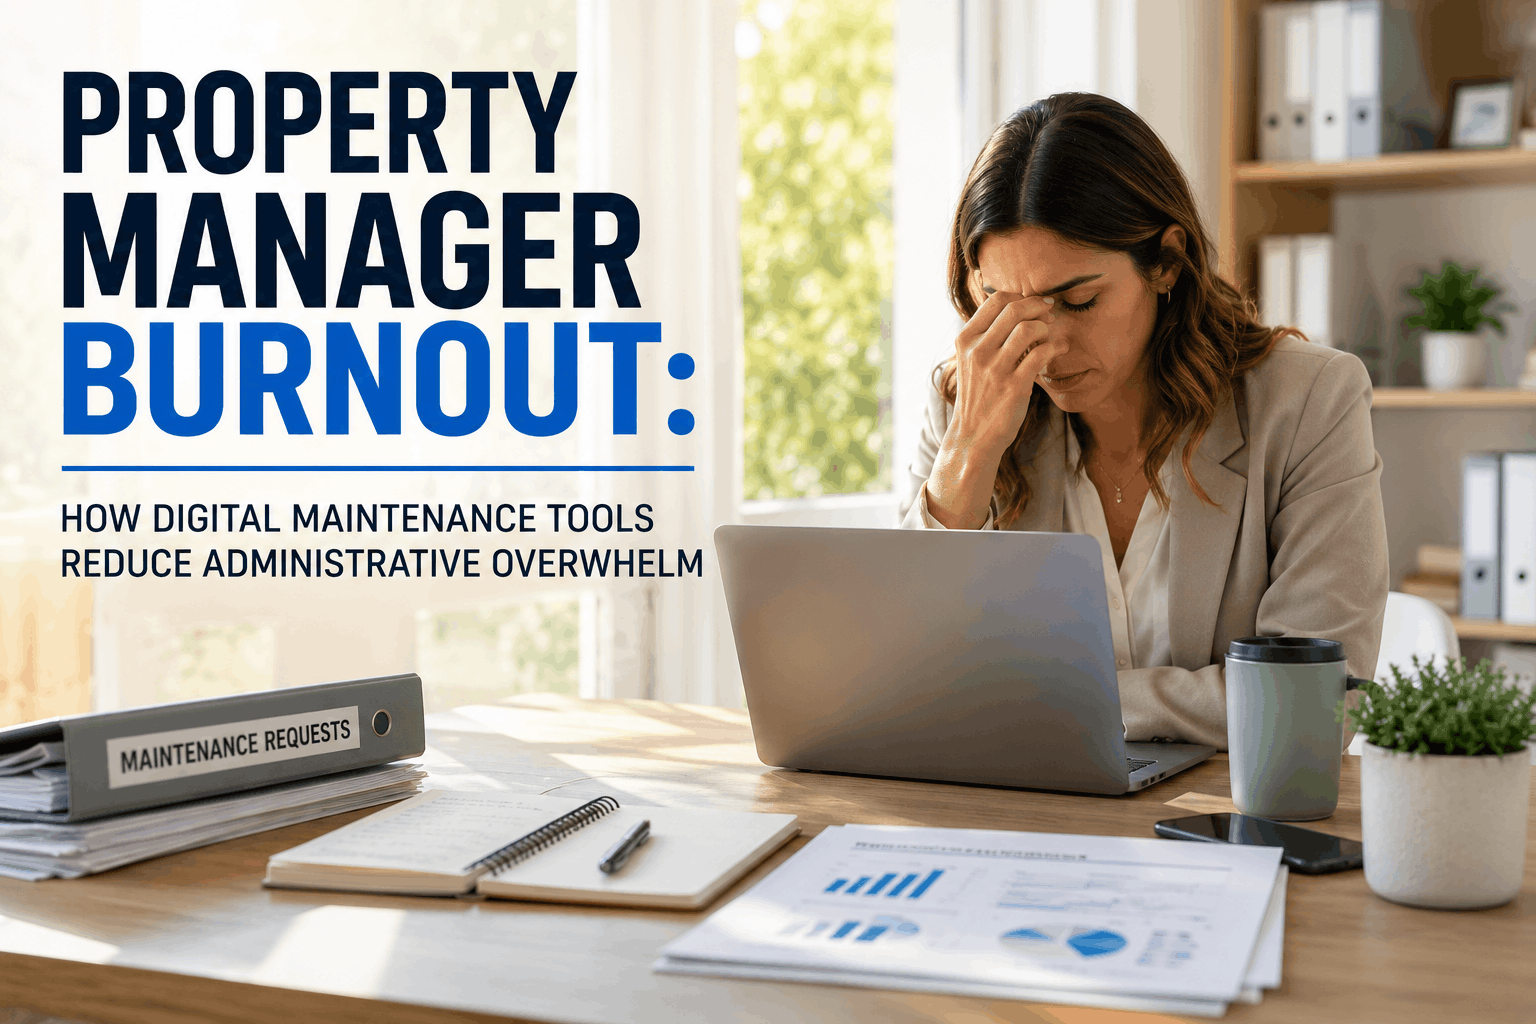
Property maintenance staffing is fundamentally a data problem — and most property managers are solving it wrong. They inherit the "one technician per 100 units" baseline and treat it as gospel, ignoring workload drivers that can double or halve actual staffing needs. When AppFolio surveyed 1,984 property professionals in 2025, they discovered that maintenance staff spend 66% of their time on routine operational tasks and just 16% on strategic work. That gap — between reactive firefighting and proactive portfolio management — is where staffing optimization happens. This guide walks property managers, asset owners, and facility directors through the data points that determine right-sizing your team, avoiding technician burnout, and keeping labor costs under control across your portfolio.
Property Maintenance Staffing: The Right Technician Ratio for Your Portfolio
One technician per 100 units is a starting point, not a plan. Your staffing needs depend on property age, amenities, deferred maintenance backlog, and tenant expectations. OxMaint's workforce analytics help you build the right team without overstaffing or burning out your crew.
The Staffing Reality: Beyond the 1-Per-100 Rule
The "one technician per 100 units" convention exists for a reason — it provides a simple starting point when nothing else is available. But a 350-unit property with 5 maintenance staff handling 2,500 customer service requests annually operates on an entirely different model than a brand-new 250-unit complex with full appliances still under warranty and no deferred maintenance backlog. The National Apartment Association's 2025 Operating Expense Standards show that larger properties spend $2,695 per unit on super and maintenance salaries alone, with variations driven by property age, local market labor costs, and service expectations. In upstate New York, where snow removal is a five-month operational requirement, staffing ratios look completely different than in Arizona. A property manager in Boston managing 1980s-era construction faces plumbing and electrical complexity that a property built in 2020 simply does not. The baseline rule of thumb breaks down immediately when you account for these variables. What matters is workload — not unit count.
Staffing Tiers: From Small to Institutional-Scale Portfolios
Right-sizing maintenance staffing depends on property portfolio size, complexity, and the data infrastructure you have to make decisions. Small property operators have different constraints than institutional investors managing 50+ assets across multiple states. Your maintenance data needs — and the staffing model that supports it — scale with portfolio complexity. OxMaint's workforce analytics give you visibility across all three tiers, from single-property operators to multi-region institutional portfolios. Staffing decisions made without data on actual workload per property lead to either chronic understaffing (staff burnout, maintenance backlog) or overstaffing (excess labor costs, reactive repair cycles continue). The following breakdown shows typical staffing structures by property portfolio size and the data challenges each tier faces.
The Cost of Chronic Understaffing: Burnout, Turnover & Deferred Maintenance
A common staffing error is underfunding maintenance labor to keep budgets tight, then accepting higher turnover and deferred maintenance as inevitable costs. This false economy is expensive. When a 350-unit property has two technicians handling 20–25 work orders per day, the team is in permanent crisis mode. Work orders pile up, response times stretch, and residents start filing complaints. Maintenance staff work overtime constantly, which burns them out and drives turnover. Replacing a technician costs $15,000–$25,000 in recruitment, training, and lost productivity. Higher turnover means less experienced staff, slower repairs, and — inevitably — deferred maintenance backlogs that will cost three times more to fix later. A small understaffing error compounds into a major budget problem within 18 months. Staffing based on actual workload data prevents this cycle. OxMaint's staffing analytics show you work order volume, average resolution time, and backlog trends — so you can identify understaffing before burnout forces staff to resign.
Using Data to Right-Size Your Team: Workload-Based Staffing Formula
Instead of inheriting the "1 per 100" rule, build your staffing model from actual workload data. Start by measuring: (1) total work orders per month across your portfolio, (2) average hours per work order (accounting for emergency vs. routine work), (3) percentage of work outsourced to contractors vs. handled in-house, and (4) time spent on preventive maintenance vs. reactive repairs. A technician can realistically handle 6–9 service requests per day when workload is balanced between emergency and routine calls. When a technician consistently handles 15–20+ daily requests, they are in permanent triage mode — addressing only the most urgent issues and letting everything else defer. This creates the conditions for a maintenance backlog to grow unchecked. Property managers using OxMaint's staffing analytics see the precise work order volume and resolution time per property, which reveals understaffing immediately. From there, you can either increase staffing, implement preventive maintenance schedules to reduce emergency calls, or outsource specific services. The data tells you which option is most cost-effective for your specific property.
We managed 8 properties with a team of 12 technicians, but we had no visibility into whether understaffing was a problem across the entire portfolio or just at specific properties. Using OxMaint's staffing dashboard, we discovered that one 350-unit property was averaging 22 work orders per day with a 2-person team — double the reasonable workload. We hired one additional technician for that property, resolution times dropped from 6 days to 2 days, and staff turnover at that site fell from 45% to 12% in the next year. The hiring cost paid for itself within eight months through reduced turnover and emergency contractor premiums.