No heavy implementation required | Works across multi-site portfolios | Live in days, not months
45%
Fewer Repeat Failures
With structured failure mode libraries (Plant Engineering, 2024)
4.8x
Higher Emergency Repair Cost
vs. planned maintenance (ARC Advisory Group)
70%
Of Failures Are Predictable
When historical patterns are properly analyzed (McKinsey)
30%
Maintenance Cost Reduction
With AI-driven failure analysis (Deloitte Industry Report)
What Is It
What Is an AI-Powered Failure Mode Library
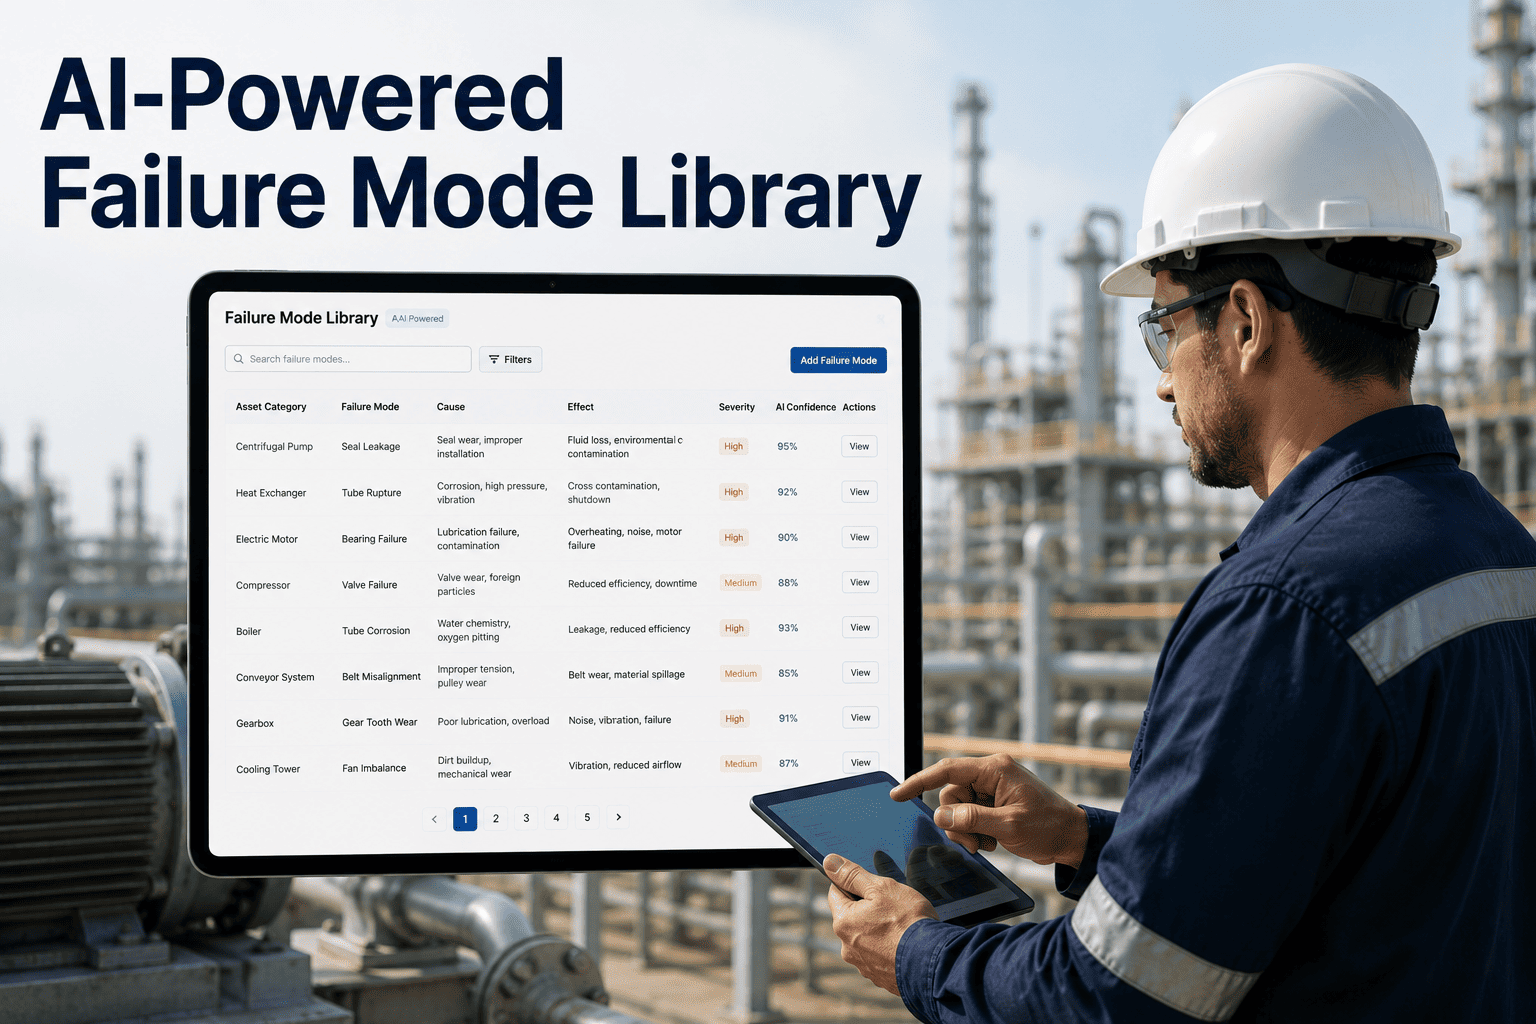
A failure mode library is a structured, searchable database of every way your assets can fail — categorized by equipment type, failure mechanism, root cause, and corrective action. When AI is layered on top, the library stops being a static reference document and becomes a living knowledge graph that connects failure patterns across work orders, sensor data, and inspection histories.
Unlike traditional FMEA spreadsheets that gather dust after one audit, a self-learning knowledge graph updates automatically. Each closed work order teaches the system: which failure mode appeared, what triggered it, how long it took to detect, and what fixed it. Over months, the AI builds failure fingerprints for every asset class in your portfolio — so the next time vibration signatures shift on Compressor C-204, it already knows what that pattern means and what comes next.
8 Components of a Self-Learning Failure Mode Knowledge Graph
01
Failure Mode Taxonomy
Structured hierarchy of failure types — mechanical, electrical, corrosion, fatigue, wear — mapped to equipment classes with ISO 14224 alignment.
02
Root Cause Ontology
Machine-readable causal graph linking symptoms to root causes. AI traverses this graph to surface likely causes before full failure investigation.
03
Failure Fingerprints
Pattern signatures derived from sensor data, vibration analysis, and inspection findings. Each fingerprint is unique to an asset class and failure mode combination.
04
Work Order Learning Loop
Every closed work order updates the knowledge graph. Technician findings, parts used, and time-to-resolution all feed the model's accuracy over time.
05
Condition Score Integration
Asset condition scores feed failure probability calculations. A bearing at condition 3 of 10 with rising temperature has a calculable failure window.
06
Cross-Site Pattern Matching
Failure patterns identified at one facility immediately apply across your portfolio. Multi-site operations gain compounding knowledge returns.
07
Recommended Action Engine
When a failure fingerprint is detected, the system auto-generates the work order with the corrective action that resolved the same pattern historically.
08
CapEx Risk Flagging
Assets accumulating failure events at accelerating rates are automatically flagged for replacement forecasting in the rolling CapEx model.
Most industrial facilities lose 20-40% of their maintenance budget repairing failures they have already repaired before — just without the data to recognize the pattern.
Pain Points
Why Traditional Failure Documentation Keeps Failing You
Knowledge Lives in People's Heads
Senior technicians retire, taking decades of failure pattern knowledge with them. No structured capture means the next breakdown is treated as if it happened for the first time.
Siloed Records Across Systems
CMMS has work orders. SCADA has sensor data. Inspection apps have findings. Nobody has connected the three, so root cause analysis is manual, slow, and often wrong.
Static FMEA Documents
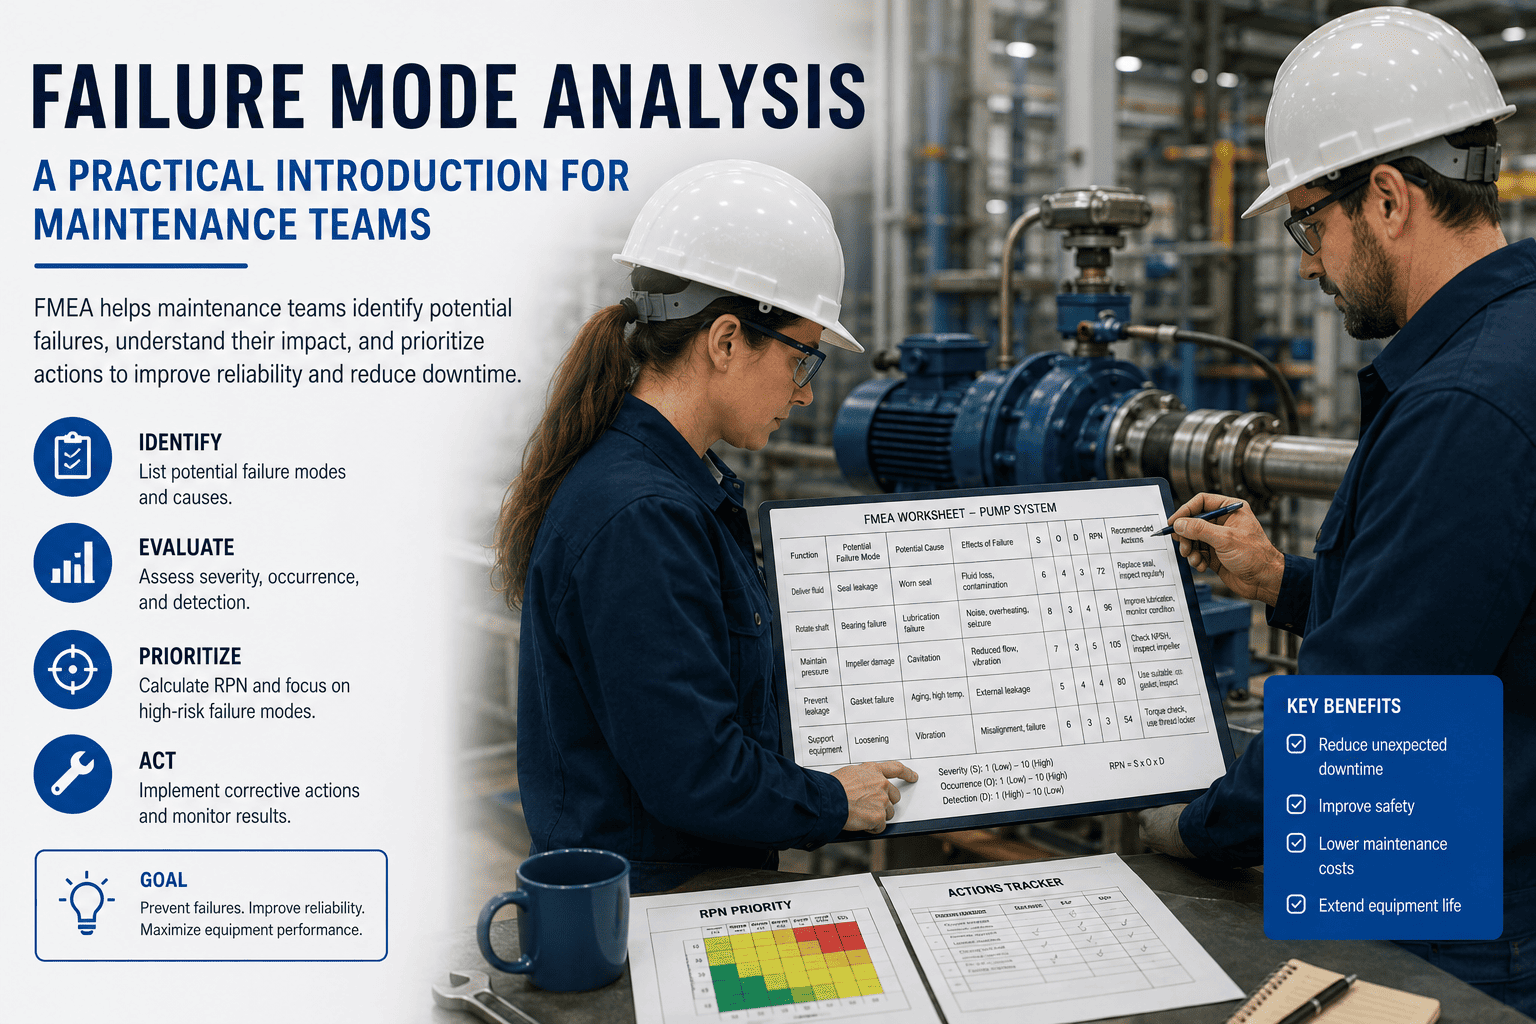
Traditional failure mode analyses are created once, reviewed rarely, and never updated with real-world outcomes. They reflect theory, not the actual failure history of your specific assets.
Repeat Failures Cost 4.8x More
Emergency repairs on failures that could have been predicted cost nearly five times more than planned maintenance. Without pattern recognition, the same failure repeats at the same cost.
Detection Always Too Late
Without fingerprint matching, failure detection happens at the symptom stage — visible damage, noise, or complete shutdown — rather than at the early parameter drift stage when intervention costs a fraction.
No Portfolio-Level Insight
Multi-site operations have no mechanism for cross-facility learning. A failure pattern solved at Site A costs full diagnostic time all over again when the same pattern appears at Site B.
How OxMaint Builds Your Self-Learning Failure Intelligence
Auto-Classified Work Orders
Every work order is automatically tagged to a failure mode category, root cause class, and asset type. No manual taxonomy effort from your team.
IoT and SCADA Pattern Matching
Sensor signatures are continuously matched against known failure fingerprints. When a match is detected, a work order is created before the failure occurs.
Failure Probability Scoring
Every asset receives a real-time failure probability score based on condition, age, operational stress, and historical failure rates for that asset class.
Portfolio-Wide Knowledge Sharing
Failure patterns confirmed at one site automatically propagate to monitoring rules at all your other sites. Cross-portfolio learning with zero manual effort.
GMP-Compliant Audit Trail
Every failure event, corrective action, and knowledge update is logged with timestamp and technician record — ready for OSHA, FDA, and regulatory review.
CapEx Failure-Risk Forecasting
Assets with accelerating failure rates are surfaced in the rolling 5-10 year CapEx model, so replacement budgets reflect actual risk — not guesswork.
Before vs After
Reactive Failure Management vs. AI-Powered Knowledge Graph
Area
Reactive Approach
OxMaint AI Knowledge Graph
Failure Detection
Discovered at breakdown — after full damage
Fingerprint matched hours or days before failure
Root Cause Analysis
Manual investigation, 4–48 hours of engineer time
Auto-suggested from historical pattern match in seconds
Knowledge Capture
Lives in a senior technician's experience
Captured in every work order, persistent across staff changes
Multi-Site Learning
Each site solves the same problem independently
Pattern at Site A becomes alert at Site B automatically
Repeat Failure Rate
Same failure recurs 2–4 times before recognition
Pattern flagged after first occurrence, prevention begins
How long before the AI library starts generating useful failure predictions
OxMaint begins matching patterns against its pre-built industrial failure taxonomy from day one. Useful predictions for your specific asset classes typically emerge within 4–8 weeks as the system accumulates work order history. Facilities with existing CMMS data can import historical records to accelerate this timeline significantly.
Does this work without IoT sensors already installed
Yes. The knowledge graph builds from work order data alone — technician findings, repair records, and inspection outcomes. IoT sensor integration adds real-time fingerprint matching, but it is not required to start building your failure mode library. You can add sensor feeds progressively as your program matures.
How does OxMaint handle failure modes unique to our specific equipment
The platform combines a pre-built taxonomy aligned with ISO 14224 and industry standards with a learning layer that captures your facility-specific failure patterns. Unique failure modes discovered at your site are added to your knowledge graph automatically and can optionally be shared across your portfolio.
Can this integrate with our existing CMMS or ERP system
OxMaint connects via standard API to most enterprise systems including SAP PM, IBM Maximo, and major SCADA platforms. Your existing work order history can be imported to seed the knowledge graph from existing records. Our team handles integration setup — no heavy IT project required.
Stop Losing Budget to Predictable Failures
Turn Every Breakdown Into Intelligence That Prevents the Next One
OxMaint's AI failure mode library grows smarter with every work order. Your assets become predictable. Your team becomes proactive. Your budget stops hemorrhaging on repeat emergencies.
Real-time asset failure visibility
Predictive failure alerts before breakdown
5-10 year CapEx forecasting from failure data
Used by operations teams managing 10,000+ assets | Measurable results in 30 days | Limited onboarding slots this quarter