Facility managers today operate in a paradox: they are responsible for assets worth $5M–$50M, yet 62% still rely on manual rounds, phone calls, and email chains to know whether critical equipment is running, failing, or already down. By the time a building management system alarm reaches the right person through the traditional chain — sensor triggers, operator notices, supervisor contacted, maintenance dispatched — the average response delay is 47 minutes. In that window, a chiller failure can spoil $120,000 in pharmaceutical inventory, a compressor shutdown can halt an entire production line at $8,500 per hour, or an HVAC failure in a data center can trigger thermal throttling across 200 servers. Real-time asset monitoring through IoT-connected CMMS dashboards eliminates this blind spot entirely — giving maintenance and operations teams a live, unified view of asset health, energy consumption, PM compliance, and failure risk across every facility in their portfolio, accessible from any device, updated every 60 seconds. Facilities using real-time CMMS dashboards report 82% reduction in unplanned downtime, 30–40% lower maintenance costs, and full ROI within 8–12 months. Start a free trial to build your live asset monitoring dashboard in Oxmaint, or book a demo to see real-time facility visibility in action.
See Every Asset. Every Facility. Every Second.
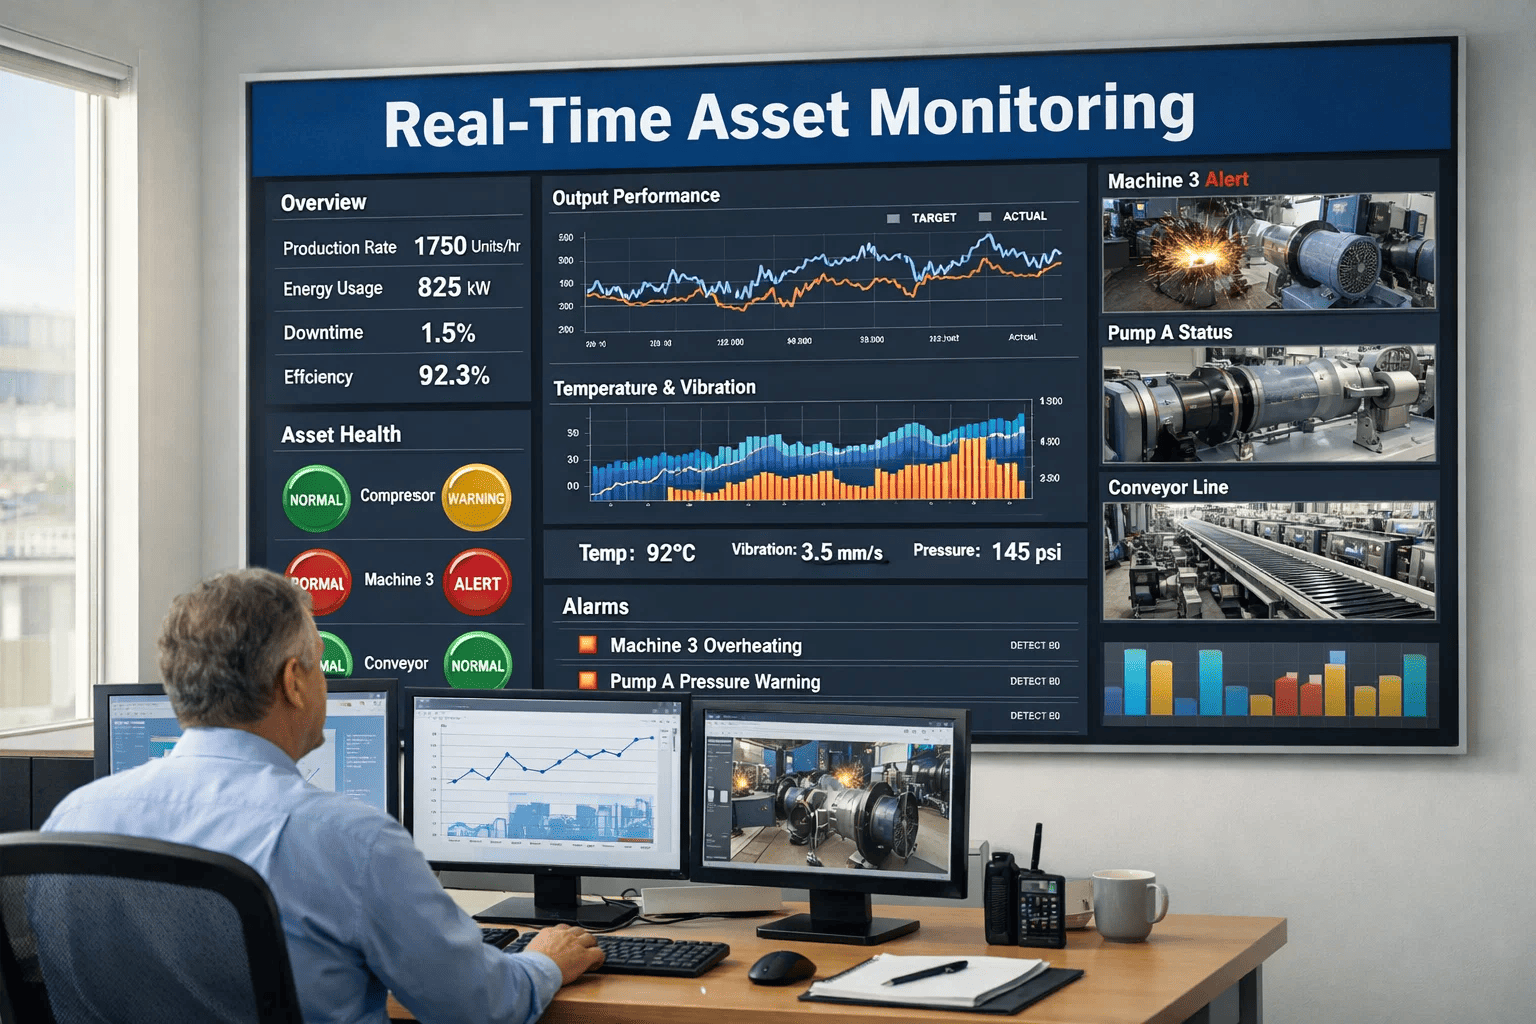
Oxmaint connects IoT sensors, BMS systems, and SCADA data into a single real-time dashboard — giving you live asset health scores, automated alerts, and instant work order generation from sensor anomalies.
What Does a Real-Time CMMS Asset Dashboard Actually Show?
A real-time asset monitoring dashboard is not a static report viewed once per week — it is a live operational command center that updates continuously from IoT sensors, work order data, and equipment runtime counters. The dashboard gives maintenance managers, facility directors, and operations leaders a single screen that answers the five questions they currently need 4–5 different systems to answer: What is running? What is degrading? What needs maintenance today? How is energy being consumed? Where is the highest risk right now? When these five views converge into one live interface connected to your CMMS work order system, the gap between knowing about a problem and acting on it shrinks from hours to seconds. Start a free trial to experience Oxmaint's dashboard with your asset data.
Asset Operating Status
Real-time running/stopped/fault status for every monitored asset. Color-coded indicators update every 60 seconds from IoT sensors and PLC data — showing which assets are operating normally, which are in alarm, and which are offline.
Condition-Based Health Rating (0–100)
Aggregate health score per asset combining sensor readings (vibration, temperature, pressure), maintenance history, age, and PM compliance. Assets scoring below 60 are flagged for immediate review with fault-specific diagnostics.
Real-Time Energy Consumption Tracking
Live energy draw per asset and per facility zone — identifying equipment consuming more energy than baseline (often a 15–25% degradation indicator), tracking consumption trends, and flagging anomalies that signal impending mechanical failure.
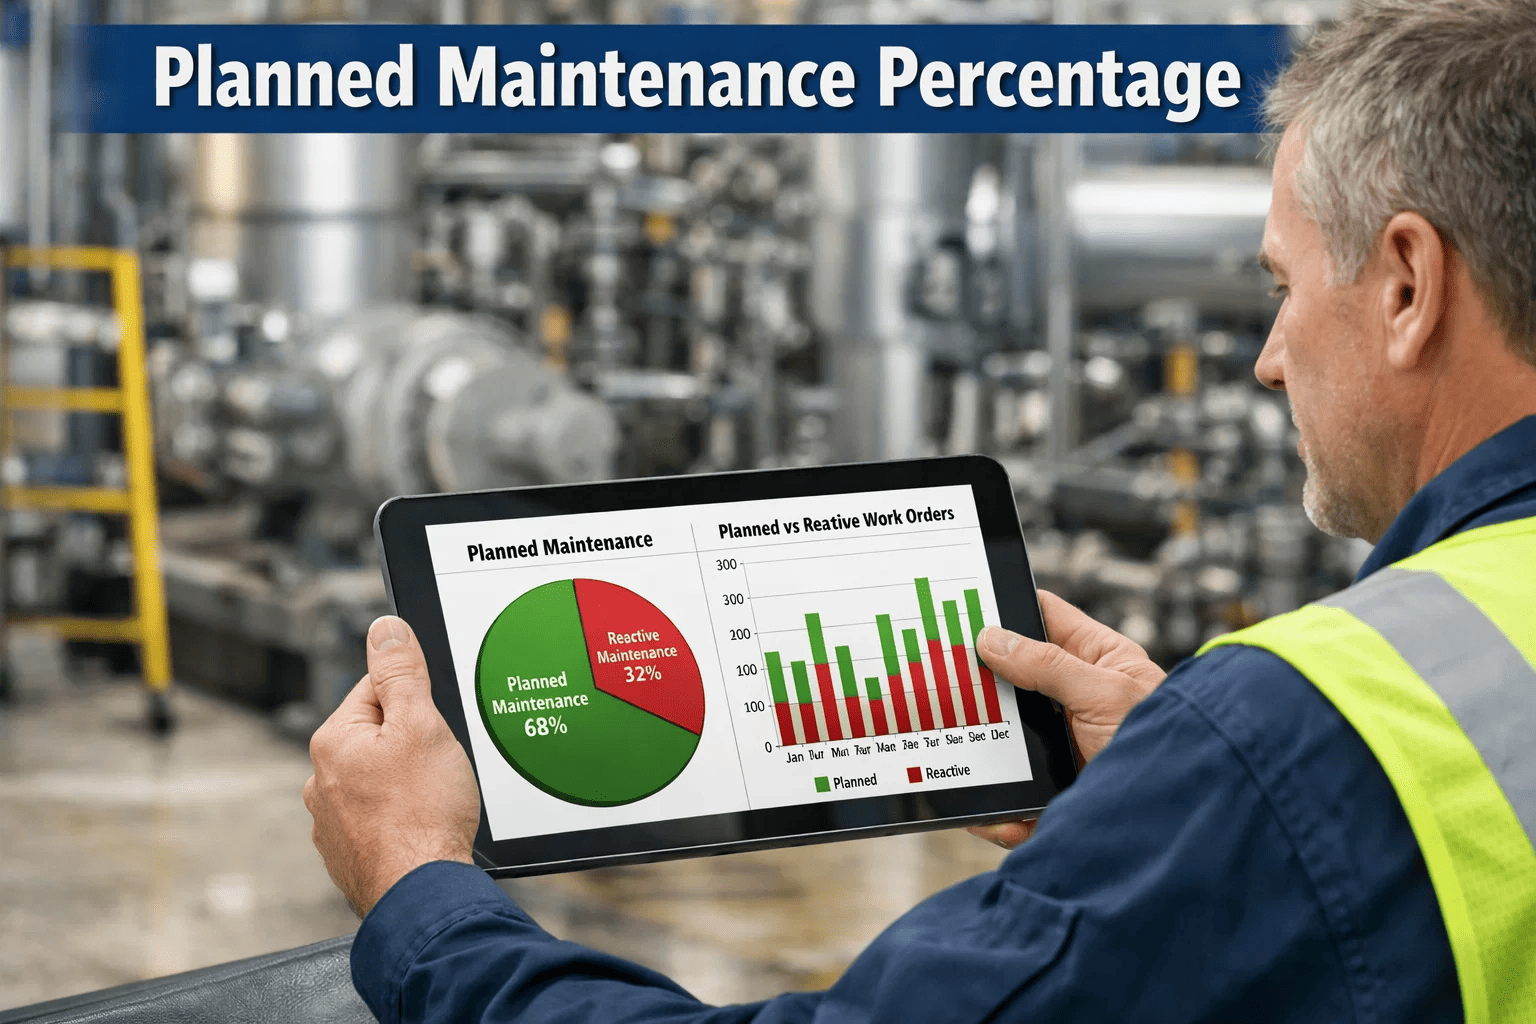
Preventive Maintenance Schedule Adherence
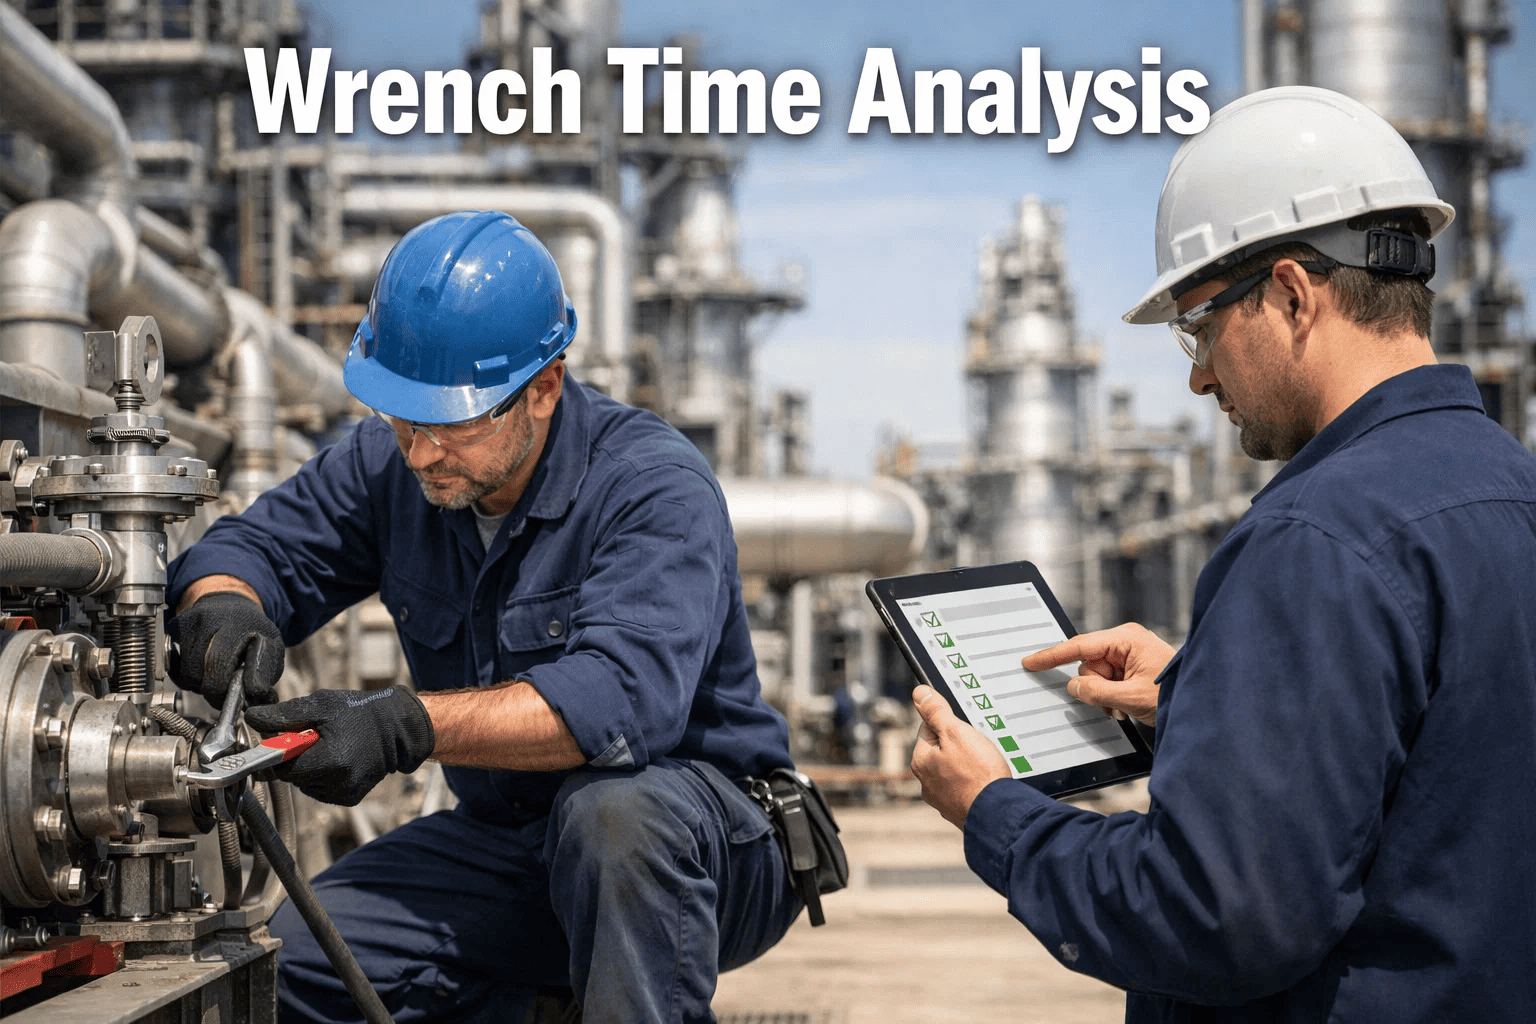
Live view of PM completion rates across all assets — on-time, overdue, and upcoming. Compliance percentage per facility, per system, and per technician. World-class target: 95%+ on-time PM completion visible at a glance.
Failure Probability Heat Map
AI-generated failure probability scores for each critical asset over the next 7–30 days — based on degradation trends, historical failure patterns, and real-time sensor anomalies. Enables resource pre-positioning and proactive scheduling.
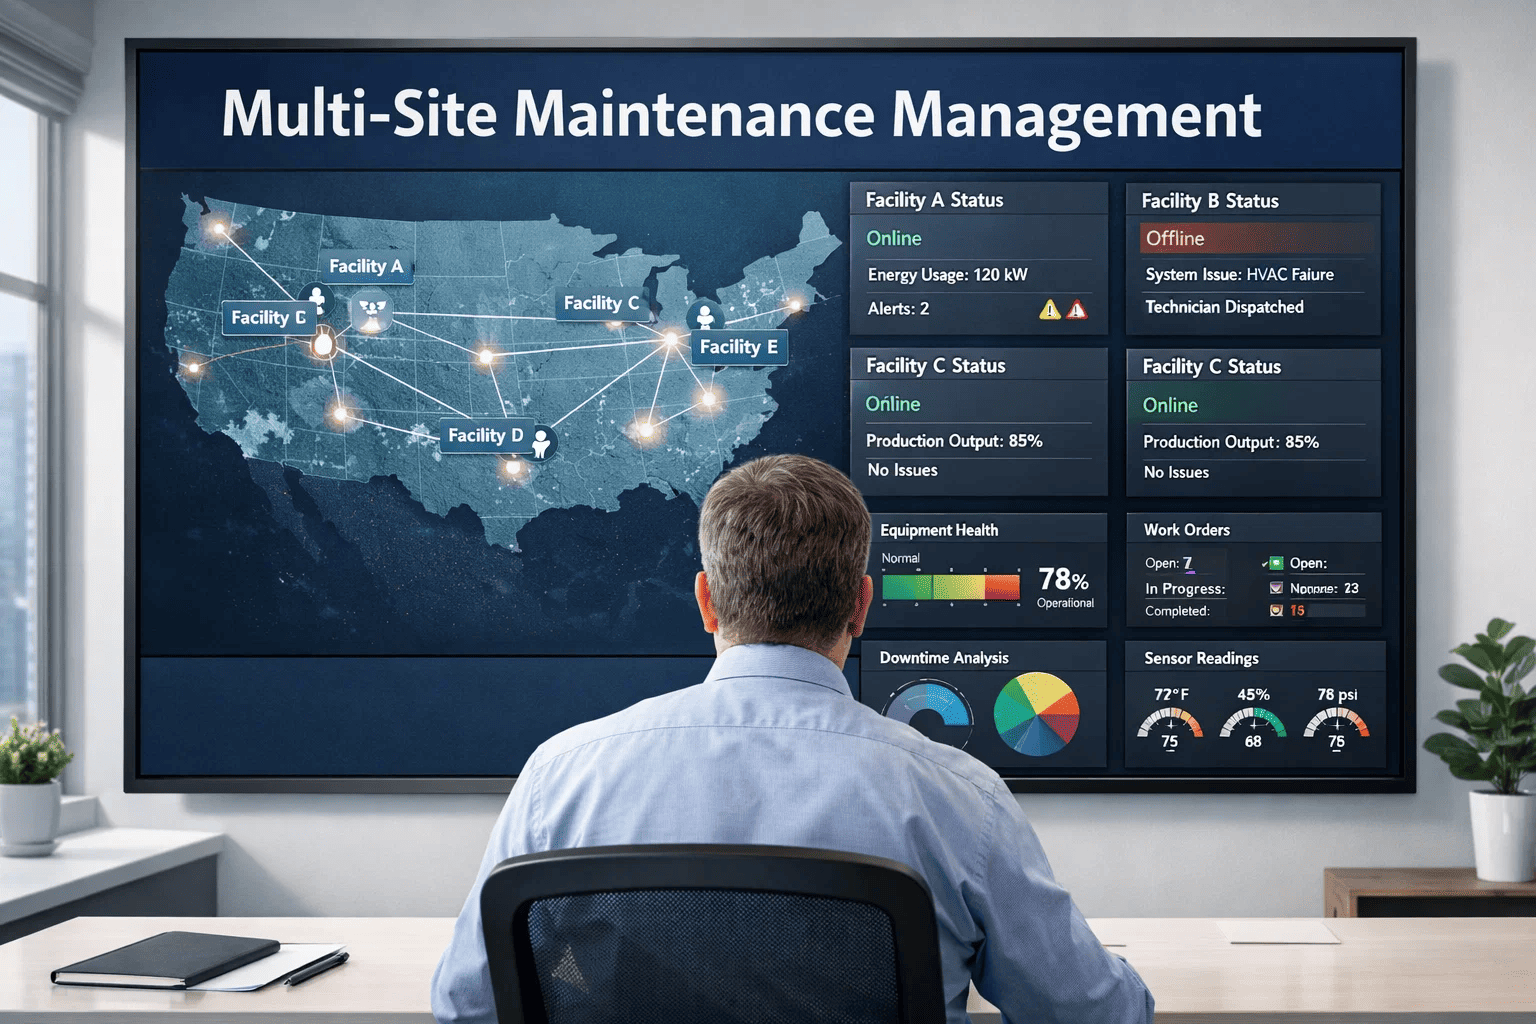
Portfolio-Level Facility Comparison
Compare KPIs across all facilities in a single view — downtime hours, PM compliance, energy cost per sq ft, MTBF, and work order backlog. Identify lagging sites, benchmark top performers, and allocate resources where impact is greatest.
The Cost of Not Seeing: What Blind Spots Actually Cost
Without real-time monitoring, every equipment issue follows the same expensive pattern: fail silently, get discovered late, trigger emergency response, and generate costs that are 4.8x higher than planned maintenance. The comparison below shows the operational reality of manual monitoring versus IoT-connected CMMS dashboards — measured across the metrics that directly impact maintenance budgets, production uptime, and energy spend. Book a demo to see how Oxmaint replaces blind spots with live operational visibility.
Essential KPIs for Your 2026 Maintenance Dashboard
Not every data point belongs on a dashboard. The most effective real-time CMMS dashboards focus on 8 KPIs that directly drive maintenance decisions and budget outcomes. These are the metrics that Oxmaint surfaces in the default dashboard configuration — refined from deployments across manufacturing, commercial real estate, healthcare, and multi-site industrial portfolios. Start a free trial to see these KPIs populated with your own asset data.
Real-Time Monitoring ROI: What the Numbers Prove
Frequently Asked Questions
What IoT sensors does Oxmaint integrate with for real-time monitoring?
Oxmaint integrates with all major IoT sensor platforms through standard protocols — MQTT, REST APIs, Modbus TCP, and BACnet. Supported sensor types include vibration (accelerometers), temperature (thermocouples, RTDs), pressure transducers, flow meters, current transformers, humidity sensors, and energy monitors. Oxmaint also integrates with existing Building Management Systems (BMS), SCADA platforms, and PLC data collectors — meaning you can leverage sensors already installed in your facility without replacing infrastructure. For facilities starting fresh, Oxmaint's integration team recommends specific sensor packages based on asset criticality, typically covering the top 20% of assets that drive 80% of downtime risk. Start a free trial to explore sensor integration options.
How long does it take to set up a real-time CMMS dashboard?
For facilities with existing IoT sensors or BMS infrastructure, Oxmaint dashboard deployment typically takes 2–4 weeks — including sensor data mapping, threshold configuration, alert rule setup, and dashboard customization. For facilities adding new sensors, add 2–3 weeks for sensor installation and commissioning. Most clients start with a Phase 1 deployment covering their 15–20 most critical assets, then expand sensor coverage based on ROI data from the initial deployment. The fastest path to value is connecting your existing BMS data to Oxmaint — this can be live within 5 business days.
Can we customize the dashboard for different user roles?
Yes — Oxmaint supports role-based dashboard views that show different information density based on the user's operational role. Facility managers see portfolio-level KPIs, cross-site comparisons, and budget metrics. Maintenance managers see work order queues, technician workloads, PM compliance, and asset health alerts. Technicians see their assigned work orders, equipment history, and real-time sensor readings for the assets they are working on. Executives see financial dashboards with cost-per-asset trends, CapEx forecasting, and benchmark comparisons. Each role gets the information density they need — not the information overload they do not. Book a demo to see role-based dashboards in action.
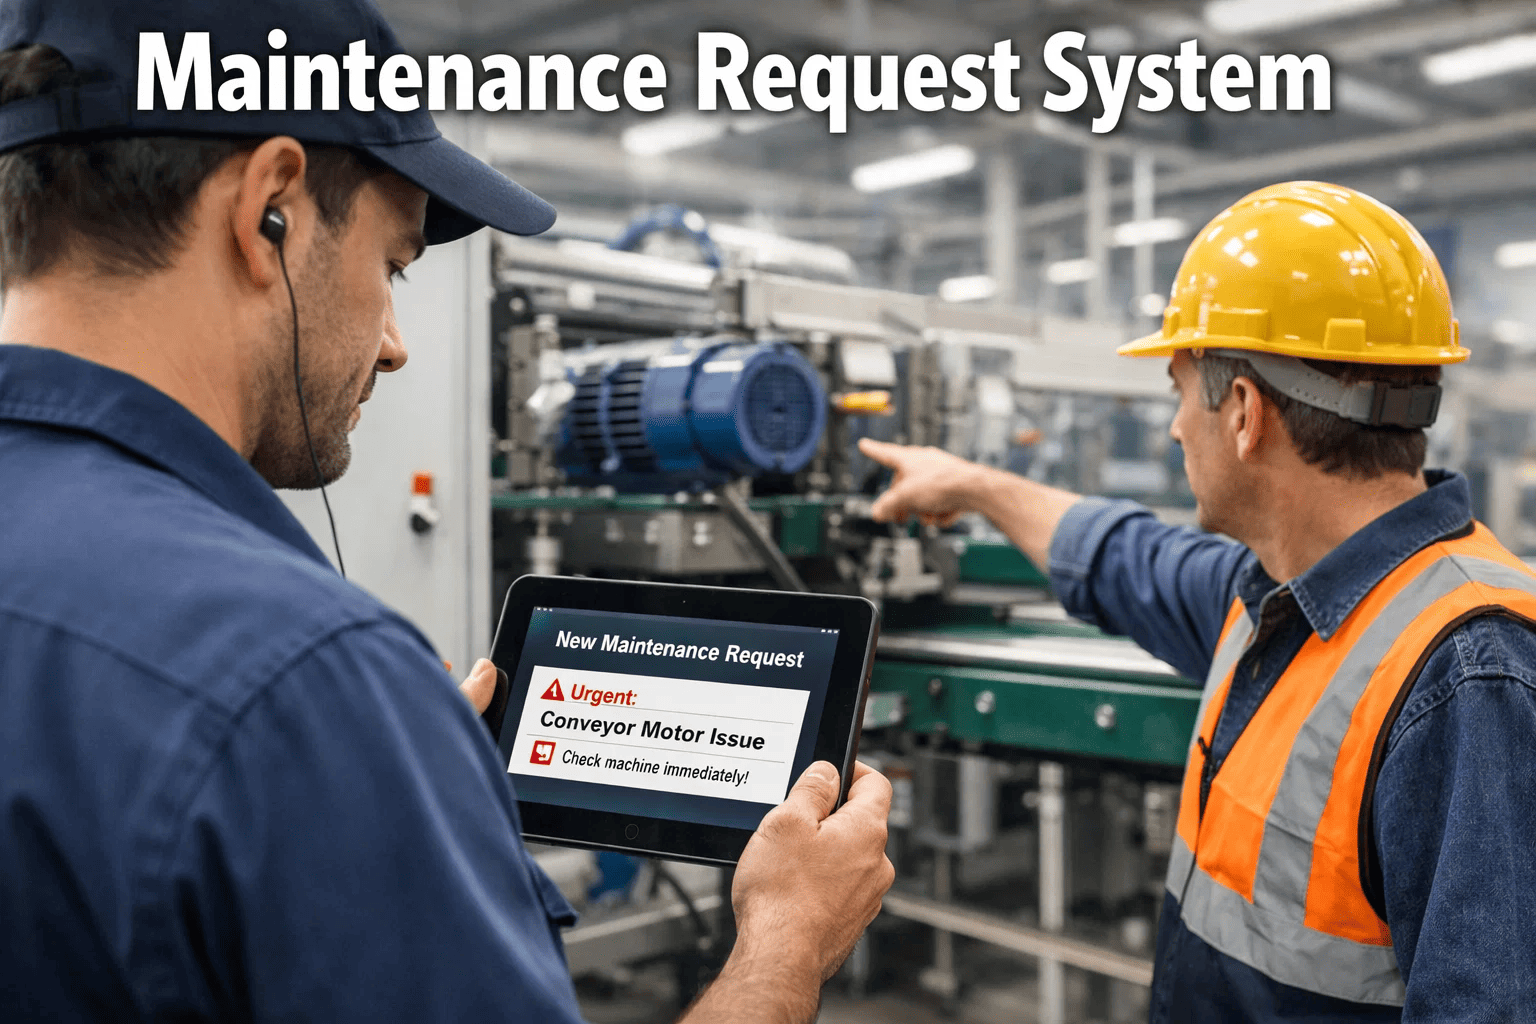
What happens when a sensor detects an anomaly — does it automatically create a work order?
Yes — Oxmaint's real-time monitoring system uses configurable threshold rules with three escalation levels. Level 1 (advisory): sensor reading exceeds normal range — dashboard indicator turns amber, logged for trend analysis. Level 2 (action): reading exceeds action threshold — automatic work order generated with priority, fault description, and recommended procedure. Level 3 (critical): reading exceeds critical threshold — immediate notification to on-call technician, automatic escalation to facility manager, and emergency work order created. Each asset's thresholds are configurable based on manufacturer specifications, historical operating data, and criticality classification. This eliminates the manual interpretation gap where alarms are seen but not acted upon.
From Blind Spots to Full Visibility — Real-Time Asset Monitoring With Oxmaint
Facility and maintenance teams across manufacturing, commercial real estate, healthcare, and multi-site portfolios use Oxmaint to replace manual rounds with live IoT dashboards — cutting unplanned downtime by 82%, maintenance costs by 30–40%, and response time from 47 minutes to seconds.