Every maintenance team inherits a backlog. The real question is whether it is shrinking or silently compounding. Industry research from BOMA International shows that unmanaged deferred maintenance grows at 5 to 8 percent annually — meaning a $200,000 backlog today becomes a $320,000 liability within three years without a single new asset failure. The facilities that control this cost do not necessarily spend more on maintenance. They spend it earlier, on the right assets, guided by data that tells them which items carry the highest risk today. Start a free trial and build your first quantified backlog report in week one, or book a demo to see how Oxmaint helps facilities reduce deferred maintenance backlogs by 40 to 60 percent in the first year.
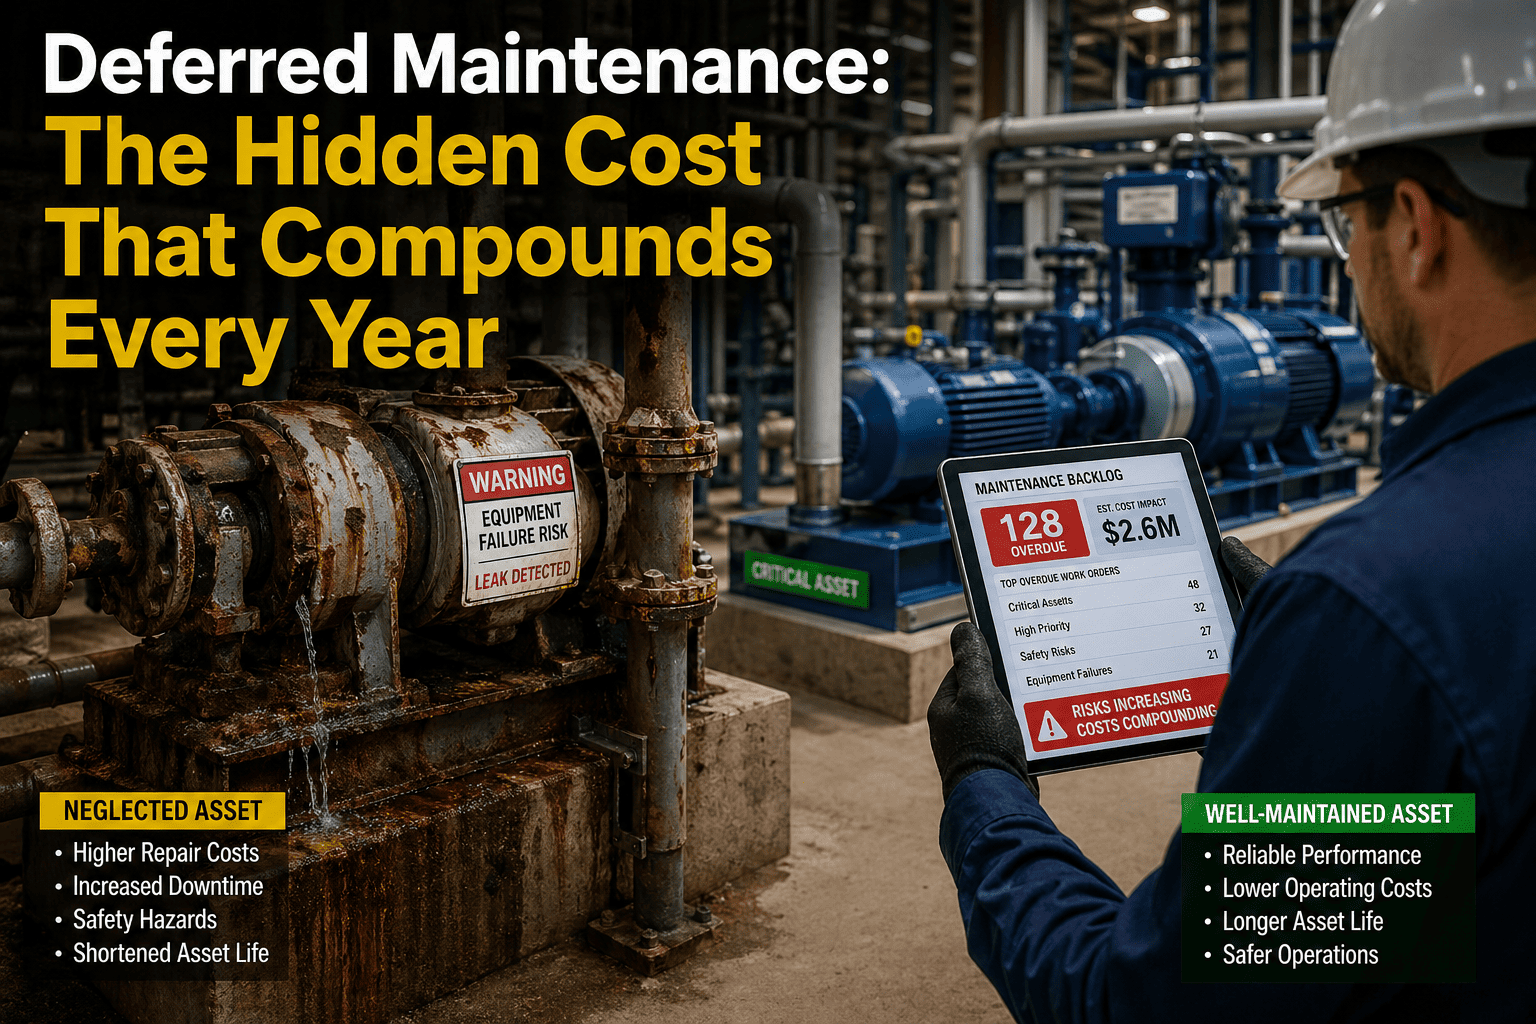
Deferred Maintenance Cost and Risk: Why It Gets Worse Every Year
Every postponed repair adds compound interest to your asset liability. This is how maintenance debt grows — and how forward-looking facilities stop the cycle before it controls their budget.
Is Your Maintenance Backlog Growing Undetected?
Oxmaint gives you a live view of every deferred item — ranked by risk, cost impact, and compliance exposure. No spreadsheets. No surprises at budget time.
What Is Deferred Maintenance — And Why It Never Stays Still
Deferred maintenance is any maintenance work that was identified and scheduled but postponed past its due date — knowingly or otherwise. It accumulates as a backlog of known risk: a growing liability that affects asset performance, operational safety, and capital budgets simultaneously. Unlike reactive emergencies, deferred items are already documented. They sit in work order queues, inspection reports, and PM schedules — often without anyone connecting them to their real financial and operational cost.
The danger is not the individual deferred item. It is the interaction between deferred items as they accumulate. A postponed bearing lubrication leads to early wear. Early wear leads to vibration. Vibration spreads to adjacent components. A $400 PM becomes a $6,000 repair in 18 months — not because of bad luck, but because of a predictable failure cascade that nobody was tracking. Ready to see what your backlog actually costs? Start a free trial and get your first backlog risk report in under a week, or book a demo to see how Oxmaint maps every deferred item to a dollar figure and a risk score.
Maintenance work that has been identified but postponed, creating a compounding backlog of known risk that grows in cost and consequence with every passing month — regardless of whether a failure has occurred yet.
The Cost Escalation Curve: How Deferral Multiplies the Bill
Research from the National Institute of Building Sciences confirms: every $1 of deferred maintenance generates $4 in future capital expenditure. The escalation is not linear — it accelerates as components interact and secondary damage spreads. Here is how that plays out across four stages.
Base repair cost. Minor part replacement, standard labour, parts on the shelf. This is the window where action costs the least and causes the least disruption.
Secondary wear begins. Adjacent components are stressed. The repair scope expands beyond the original item. Labour time increases. Planned downtime is no longer avoidable.
System-level degradation. The failure is no longer contained to the original component. Long-lead-time parts may be required. Emergency risk is now elevated and safety exposure is real.
Asset failure territory. Full replacement is likely. Safety incidents, regulatory violations, and unplanned production loss compound the cost beyond the asset itself. Budget becomes reactive and uncontrollable.
6 Ways Deferred Maintenance Is Damaging Your Operation Right Now
Safety Incident Exposure
Deferred electrical, mechanical, and structural maintenance is a primary driver of workplace safety failures. OSHA penalties average $15,625 per violation — and equipment failures caused by neglected maintenance are rarely covered by insurance. The liability compounds alongside the backlog.
Invisible Backlog Cost
Most facilities track individual work orders — not the aggregate deferred liability. A team managing 200 open deferred items has no single number for the total risk exposure. Without that figure, budget conversations are guesswork and leadership decisions are made on incomplete data.
Compliance and Audit Gaps
Regulatory inspections in the USA (OSHA), UK (HSE), and UAE (OSHAD-SF) require documented evidence that known deficiencies are being actively managed. A growing deferred backlog with no prioritization trail is an audit failure waiting to happen — and a legal liability once it does.
Shortened Asset Lifespan
Assets operating beyond their designed maintenance intervals degrade 30 to 40 percent faster than proactively maintained equivalents. Equipment scheduled for 15-year replacement cycles often reaches end-of-life at 9 to 11 years in deferred environments — forcing CapEx spend years ahead of plan.
Budget Unpredictability
Emergency repairs average 4.8x the cost of planned maintenance for the same scope of work. When backlogs turn into failures, they do not just cost more — they cost more at the worst possible time, disrupting approved budgets, pulling from contingency funds, and triggering unplanned CapEx requests mid-year.
Team Morale and Capacity Loss
Maintenance teams stuck in reactive mode spend more than 60 percent of their labour hours responding to failures — leaving insufficient capacity for preventive work. This creates a self-reinforcing cycle: fewer PMs lead to more failures, which consume the capacity needed to reduce the backlog driving the failures.
How Oxmaint Turns Maintenance Debt Into a Managed, Shrinking Liability
Oxmaint does not just track work orders. It quantifies your deferred maintenance backlog, assigns risk scores to every item, and gives your team the prioritised action plan needed to reduce it — systematically, not reactively. Here is how each module contributes.
Asset Condition Scoring
Every asset in your portfolio receives a live condition score updated from inspection records, PM completion history, and failure logs. The score tells you not just what is deferred — but which assets are at highest risk of failure in the next 90 days.
Risk-Priority Backlog View
Oxmaint surfaces every deferred item ranked by criticality, compliance impact, and cost-to-wait — so your team always knows which deferred item to address first. No more backlog management by gut feel or loudest request.
Automated PM Scheduling
Preventive maintenance schedules are automatically triggered based on asset records — calendar intervals, runtime hours, cycle counts, or condition thresholds. PMs that would have been deferred due to manual scheduling gaps are now issued automatically before the window closes.
Predictive Alert Engine
Oxmaint's alert engine monitors asset condition trends and flags items approaching failure thresholds before they become emergencies. Teams that use predictive alerts reduce unplanned failures by 35 to 50 percent compared to time-based PM schedules alone.
Rolling 5–10 Year CapEx Forecast
Deferred maintenance creates CapEx surprises. Oxmaint's CapEx forecasting model uses condition scores and asset age data to project replacement costs across a 5 to 10 year horizon — giving ownership and finance teams the lead time needed to plan, not react.
Compliance Documentation Trail
Every deferred item, every inspection outcome, and every PM completion generates an audit-ready digital record with timestamps and technician signatures. Regulators and auditors see a managed backlog with clear prioritization evidence — not an undocumented risk exposure.
Deferred Approach vs. Oxmaint: The Reality of What Each Produces
| Aspect | Without Oxmaint | With Oxmaint |
|---|---|---|
| Backlog visibility | Spreadsheet estimates — incomplete and out of date by the time they are reviewed | Live quantified backlog with cost and risk scores updated from every closed inspection |
| Failure prediction | No foresight — teams discover failures when the asset stops working | Condition-based risk alerts flag items 30 to 90 days before the failure window |
| CapEx planning | Annual guesses submitted without asset-level data to support the numbers | Rolling 5-year model built from condition scores and asset age — reviewed monthly |
| Compliance posture | Manual audits reveal deferred items that should have been documented and escalated | Continuous digital trail with technician signatures — audit-ready at any time |
| Emergency repair rate | 60 to 70 percent of work is reactive — team runs from failure to failure | Under 20 percent reactive spend — PM compliance rate above 85 percent |
| Asset lifespan | Shortened by 30 to 40 percent — CapEx replacement forced years early | Extended by 20 to 35 percent — assets reach full design life with documented PM history |
Results From Facilities That Stopped Deferring and Started Managing
Facilities that shift from reactive to planned maintenance eliminate the emergency markup — the same repair scope at a fraction of the crisis cost.
Oxmaint customers report an average 68 percent reduction in unplanned asset downtime within 12 months of deploying condition-based maintenance scheduling.
Planned maintenance costs 40 percent less on average than equivalent reactive spend — the same assets, the same work, at a fraction of the cost when done on schedule.
When emergency repair savings, extended asset life, and reduced CapEx surprises are combined, Oxmaint customers consistently report 3 to 4x ROI within the first 12 months.
Frequently Asked Questions
What exactly counts as deferred maintenance in a CMMS?
Deferred maintenance in Oxmaint includes any PM that passed its scheduled due date without completion, any corrective work order that has been open beyond 30 days without resolution, and any inspection finding that generated a follow-up task still pending action. Oxmaint tracks all three categories separately and surfaces them in a consolidated backlog dashboard with cost estimates and risk scores attached to each item. Start a free trial to see how your current backlog is categorised and costed automatically, or book a demo to walk through the backlog module with our team.
How does Oxmaint help me quantify the financial cost of my backlog?
Oxmaint attaches a cost-to-wait estimate to every deferred item — calculated from the repair cost at current stage, the projected cost at failure, and the time elapsed since the item was scheduled. The dashboard shows a total backlog liability figure, updated daily, that you can present to finance, ownership, or board-level audiences with full data backing. This transforms the annual "we need more budget" conversation into a specific, data-supported case. For facilities already using Oxmaint, the backlog cost report is available from day one of work order history import.
Can Oxmaint help with compliance in regions like the USA, UK, and UAE?
Yes. Oxmaint's documentation trail is designed to satisfy regulatory requirements across multiple regions — OSHA in the USA, HSE and Building Safety Act in the UK, and OSHAD-SF in the UAE. Every deferred item generates a time-stamped record showing when it was identified, how it was prioritised, and what corrective action was taken. The platform also supports digital inspection forms with technician signatures that are accepted as audit evidence. Oxmaint has been deployed across commercial, industrial, and healthcare facilities in all target regions.
How quickly can a facility begin reducing its deferred maintenance backlog with Oxmaint?
Most facilities are operational in Oxmaint within one to two weeks — no lengthy implementation projects, no heavy IT involvement. The first step is importing your asset register and existing PM schedules, which the Oxmaint team supports. By week two, your team has a live backlog view ranked by risk and cost. The first measurable backlog reduction typically occurs within 30 to 60 days as teams work from the prioritised queue rather than the loudest request. Facilities that started with a reactive maintenance rate above 65 percent have reduced it below 30 percent within six months using Oxmaint's PM scheduling and backlog prioritisation tools. Start a free trial today and have your first risk-ranked backlog report within the first week, or book a demo to see the full implementation timeline for your type of facility.
Your Backlog Is Already Costing You. The Only Variable Is How Much Longer You Wait.
Oxmaint gives you the risk-ranked backlog view, automated PM scheduling, condition scoring, and CapEx forecasting that turns maintenance debt into a managed, shrinking liability — not an annual budget shock.