Every property management operations director sees the same pattern across the portfolio — the same tenant complaint comes back three times in 90 days, the same unit logs four HVAC tickets in a single quarter, the same building lobby generates the same elevator service request every 21 days, and the maintenance team treats each one as a fresh incident because nobody has connected the events to a root cause. Recurring tenant complaints are not maintenance failures. They are root-cause analysis failures masquerading as work order volume. Property management teams running structured root cause analysis report 30 to 50 percent reductions in emergency repair cost through proper preventive triggers, $47,000 average annual compliance penalty risk avoided per property, and tenant complaint volumes that drop dramatically once the underlying causes are surfaced and closed. Operations directors building structured root cause programs start a free trial on the property generating the most repeat complaints first and prove the model before extending it across the portfolio.
Property Management Analytics Brief
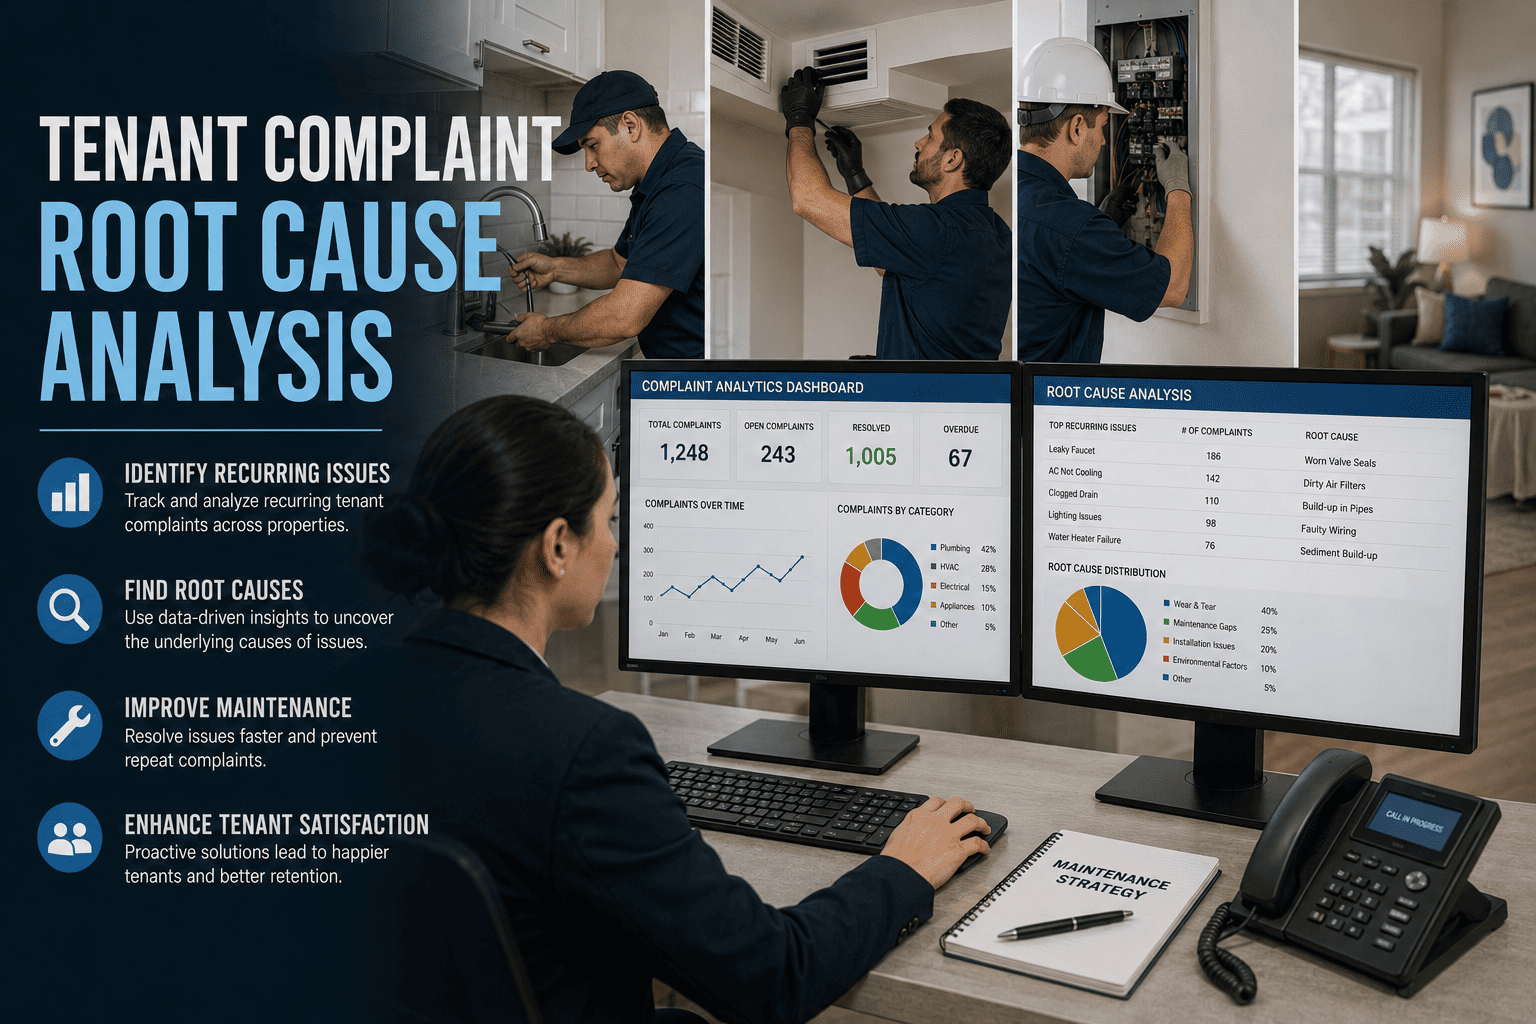
Tenant Complaint Root Cause Analysis
Identify recurring repair causes, reduce repeat work, surface the underlying asset and process issues that drive tenant complaints, and convert complaint volume into a portfolio-level analytics signal.
01
Complaint Pattern Detection
03
Root Cause Investigation
30-50%
Emergency repair cost reduction reported on portfolios using structured preventive triggers from root cause analysis
$47K
Average annual compliance penalty risk per property avoided through structured maintenance documentation
52%
Faster tenant request resolution reported on multi-property CMMS programs with priority-driven allocation
4.8x
Cost ratio of reactive repair events versus planned preventive maintenance closure of root causes
What Is Tenant Complaint Root Cause Analysis
Tenant complaint root cause analysis is the structured discipline of treating each complaint as a data point against the underlying asset, the supporting system, and the supporting process — not as an isolated work order. The objective is to identify the real cause of recurrence and close it permanently, instead of dispatching the same technician to the same unit for the same fault three times in a quarter.
The discipline applies across multi-family residential, commercial office, mixed-use, and student housing portfolios. The signal source is the work order history — and when the work order history runs against the asset registry, the patterns become impossible to miss. Operations directors ready to install the analytics book a demo and walk through the recurrence pattern on the worst-performing property in the portfolio.
Recurring tenant complaints are not maintenance failures. They are root-cause analysis failures masquerading as work order volume.
The Six Patterns That Drive Recurring Tenant Complaints
Recurring complaint volume across multi-property portfolios traces back to six pattern types. Each one is detectable in the work order history when the CMMS runs structured root cause analytics — and each one carries a specific remediation that closes the loop permanently.
P1
Aging Asset Past Service Life
The HVAC condensing unit installed in 2009 keeps failing. The unit is past replacement age. The work orders are not maintenance issues — they are deferred CapEx that has become a tenant experience problem.
P2
Wrong-Spec Replacement Part
The vendor installed a generic substitute on the last three repairs. The substitute fails on the same fault mode every 90 days. The fix is a parts specification update, not another technician callout.
P3
Missing or Wrong PM Cadence
The asset has no PM schedule, or the PM is on a calendar interval that does not match actual usage. The reactive work orders fill the gap that the PM should have closed.
P4
Building Envelope or Structural Cause
The same unit logs water intrusion complaints. The fix is not in the unit — it is in the roof, the window flashing, or the building envelope. The maintenance team has been treating a symptom for two years.
P5
Operator or Occupant Behavior
The same tenant logs the same fault repeatedly because of a use pattern that the maintenance team can document and address with tenant communication, not another work order.
P6
Contractor Quality or Workmanship
A specific contractor leaves a backlog tail behind every visit. The repeat callouts trace back to the contractor's workmanship — and the procurement decision needs an evidence-based revisit.
Six patterns, six remediations, every one of them detectable in the structured work order history. Operations directors ready to surface the patterns in their own portfolio start a free trial and load the worst-performing property first.
Why Root Cause Analysis Fails Without Structured CMMS Data
Root cause analysis is a discipline that property management teams know they should do — and rarely do. Six structural gaps explain why it stays a quarterly intention and never becomes a weekly operating habit.
Complaints Tracked at Tenant Level, Not Asset Level
Tenant called, ticket closed, ticket archived against the tenant record. The same fault on the same asset never aggregates because the system tracks who called, not what failed.
No Pattern Detection on Recurrence
Three callouts to the same unit in 90 days look like three independent tickets in the work order list. No alert, no aggregation, no pattern surfaces in the operational view.
Asset Age and Replacement Status Invisible
The asset registry does not carry install date, service life remaining, or replacement budget tag. Deferred CapEx hides as recurring maintenance cost until the asset finally fails completely.
Parts Specification Lives in Vendor Memory
The right replacement part is in the OEM manual that nobody opens. The vendor substitutes generic parts, the substitute fails repeatedly, and the parts specification gap never surfaces.
Cross-Asset Patterns Stay Within Property Silos
The HVAC condenser failure pattern across 12 units in three different buildings would tell the portfolio director it is a model-level problem, not a unit-level problem. The view never aggregates above the property line.
No Contractor Quality Trace
The contractor that leaves a 30-day callback tail behind every visit keeps getting the work because nobody runs the contractor against repeat-fault analytics. Procurement spend follows habit, not evidence.
Every one of these collapses when the work order history runs through structured root cause analytics on one CMMS — and the operations directors ready to install the discipline book a demo and walk through the pattern detection on their own portfolio data.
Three callouts to the same unit in 90 days look like three independent tickets — until the CMMS aggregates them at the asset level and the pattern becomes impossible to miss.
How OxMaint Surfaces Root Cause Patterns Automatically
OxMaint runs the work order history against the asset registry and the vendor portal continuously. Recurrence patterns surface at the asset, the property, and the portfolio level, and the operations director moves from chasing complaints to closing root causes.
01
Recurrence Detection Engine
Repeat faults on the same asset within configurable windows flag automatically. Three callouts in 90 days no longer hide as three independent tickets — the pattern surfaces as a single alert.
02
Asset Lifecycle Status Integration
Install date, service life remaining, and replacement budget tag live on the asset record. Recurring complaints on an end-of-life asset route to CapEx planning, not another maintenance work order.
03
Parts Specification Library
OEM-spec replacement parts live against each asset. Vendor substitutions flag automatically, and the parts spec discipline holds across every callout.
04
Cross-Property Pattern Aggregation
Same fault on the same asset model across multiple properties surfaces as a portfolio-level signal. Model-level problems get model-level solutions, not building-by-building triage.
05
PM Cadence Adjustment Trigger
Recurring reactive volume on an asset triggers a PM cadence review. The PM schedule moves to match actual usage, and the reactive volume drops.
06
Contractor Quality Analytics
Repeat callouts following a contractor visit aggregate against the contractor record. The procurement decision runs on evidence rather than habit.
For operations directors managing property portfolios in the USA under varied state landlord regulations, in Canada under provincial tenant protection codes, in the UK under the Building Safety Act and Decent Homes Standard, in the UAE under Vision 2030 real estate quality benchmarks, in Australia under residential tenancy authorities, or in Germany under Mietrecht and HGB property obligations — the root cause model is the same and the analytics signal travels across the portfolio. Start a free trial on the property generating the most repeat complaints first.
Reactive Complaint Handling Versus Root Cause Operating Model
The gap between reactive complaint handling and structured root cause analysis shows up in the same eight places every quarter. The table below maps where the recurrence cost lives and where the CMMS removes it.
| Analysis Discipline | Reactive Complaint Handling | CMMS Root Cause Operation |
|---|
| Complaint aggregation | Tracked at tenant level, no asset-level rollup | Aggregated at asset, property, and portfolio level |
| Recurrence detection | Three callouts look like three independent tickets | Recurrence engine flags pattern as a single alert |
| Asset lifecycle visibility | Install date and service life not tracked on the record | Lifecycle status lives against every asset record |
| Parts specification control | Lives in vendor memory, generic substitutes accepted | OEM-spec parts library against every asset |
| Cross-property pattern view | Stays within property silos, model-level patterns hidden | Portfolio-wide aggregation by asset model |
| PM cadence adaptation | Calendar interval never adjusts to actual usage | Reactive volume triggers PM cadence review |
| Contractor quality tracking | Procurement runs on habit and gut feel | Repeat-callout analytics drive procurement decisions |
| Tenant experience outcome | Recurring complaints, eroding satisfaction, renewal risk | Permanent closure of root causes, rising satisfaction |
Operations directors moving the complaint program from the left column to the right book a demo and walk through the root cause analytics on their own portfolio.
ROI and Outcome Numbers Reported on Root Cause Programs
These are the outcomes property management operations directors report after a full year on CMMS-driven root cause analytics. Variance depends on portfolio size and starting condition, but direction is consistent across multi-family, commercial, mixed-use, and student housing operations.
30-50%
Reduction in emergency repair cost through preventive triggers from structured root cause analytics
52%
Faster tenant request resolution reported on multi-property CMMS with priority-driven allocation
$47K
Average annual compliance penalty risk per property avoided through documented maintenance
38%
Lower emergency repair cost on portfolios running structured CMMS backlog and root cause analysis
27%
Improvement in vendor accountability through repeat-callout analytics and digital work verification
4 mo
Typical payback period on CMMS root cause analytics investment for mid-size property portfolios
Property management directors stacking these returns across multi-property portfolios start a free trial on the property generating the most repeat complaints and use first-year results to fund the wider rollout.
Frequently Asked Questions on Tenant Complaint Root Cause Analysis
How does OxMaint detect recurring complaints on the same asset
The recurrence detection engine runs every closed work order against the asset registry. Repeat faults on the same asset within configurable time windows — 30, 60, or 90 days — flag automatically as recurrence alerts. Three callouts to the same unit in 90 days no longer hide as three independent tickets. The pattern surfaces as a single alert that routes to the operations director for root cause review.
Can the analytics identify model-level patterns across multiple properties
Yes. Cross-property pattern aggregation runs against asset model rather than asset instance. The HVAC condenser failure pattern across 12 units in three buildings surfaces as a model-level problem requiring a model-level solution — recall replacement, parts specification update, or capital refresh — rather than 12 separate maintenance investigations.
How does the system handle contractor quality patterns
Repeat callouts that follow a contractor visit within a configurable window aggregate against the contractor record. The procurement decision runs on evidence rather than habit. Contractors leaving a 30-day callback tail behind every visit surface in the contractor performance report, and the SLA and procurement conversation has documented data behind it.
How long does it take to start surfacing root cause patterns
Most property management teams start surfacing patterns within 30 to 60 days of CMMS go-live. Existing work order history can migrate during onboarding, which gives the recurrence engine an immediate dataset to analyze. Properties with rich existing history surface patterns from day one — and the analytics get sharper as live work order volume builds against the new asset registry.
From Recurring Complaints to Closed Root Causes
Identify Recurring Repair Causes and Reduce Repeat Work Permanently
Recurring tenant complaints are root cause analysis failures masquerading as work order volume. OxMaint surfaces the recurrence patterns, ties them to the asset lifecycle, parts specification, PM cadence, and contractor quality records, and gives the operations director a portfolio-level analytics signal that closes root causes permanently.
Recurrence detection at asset, property, and portfolio level
Cross-property model-level pattern aggregation
Contractor quality analytics behind every procurement decision
Patterns surface in 30 to 60 days
Works across 5 to 200 properties
Portfolio-wide analytics rollup
Migrate existing work order history