A maintenance manager and a CFO can look at the same building and see two different worlds. The PM sees a backlog list — the failing roof, the aging chillers, the deferred repairs stacking up. The CFO sees a spreadsheet with no way to tell whether that backlog is a rounding error or a crisis. The Facility Condition Index is the bridge: one number that expresses your entire deferred-maintenance backlog as a percentage of what the asset would cost to replace. It's the rare maintenance metric a CFO instantly understands, because it speaks their language — cost against value, risk as a ratio. Learn to calculate it, benchmark it, and use it to win capital, and you turn "we need money for repairs" into a defensible financial case. This guide shows how, and where OxMaint's maintenance management software keeps the backlog data behind your FCI live and trustworthy. Start free or book a demo.
Facilities · Capital Planning · FCI Metric · CFO ↔ PM Bridge
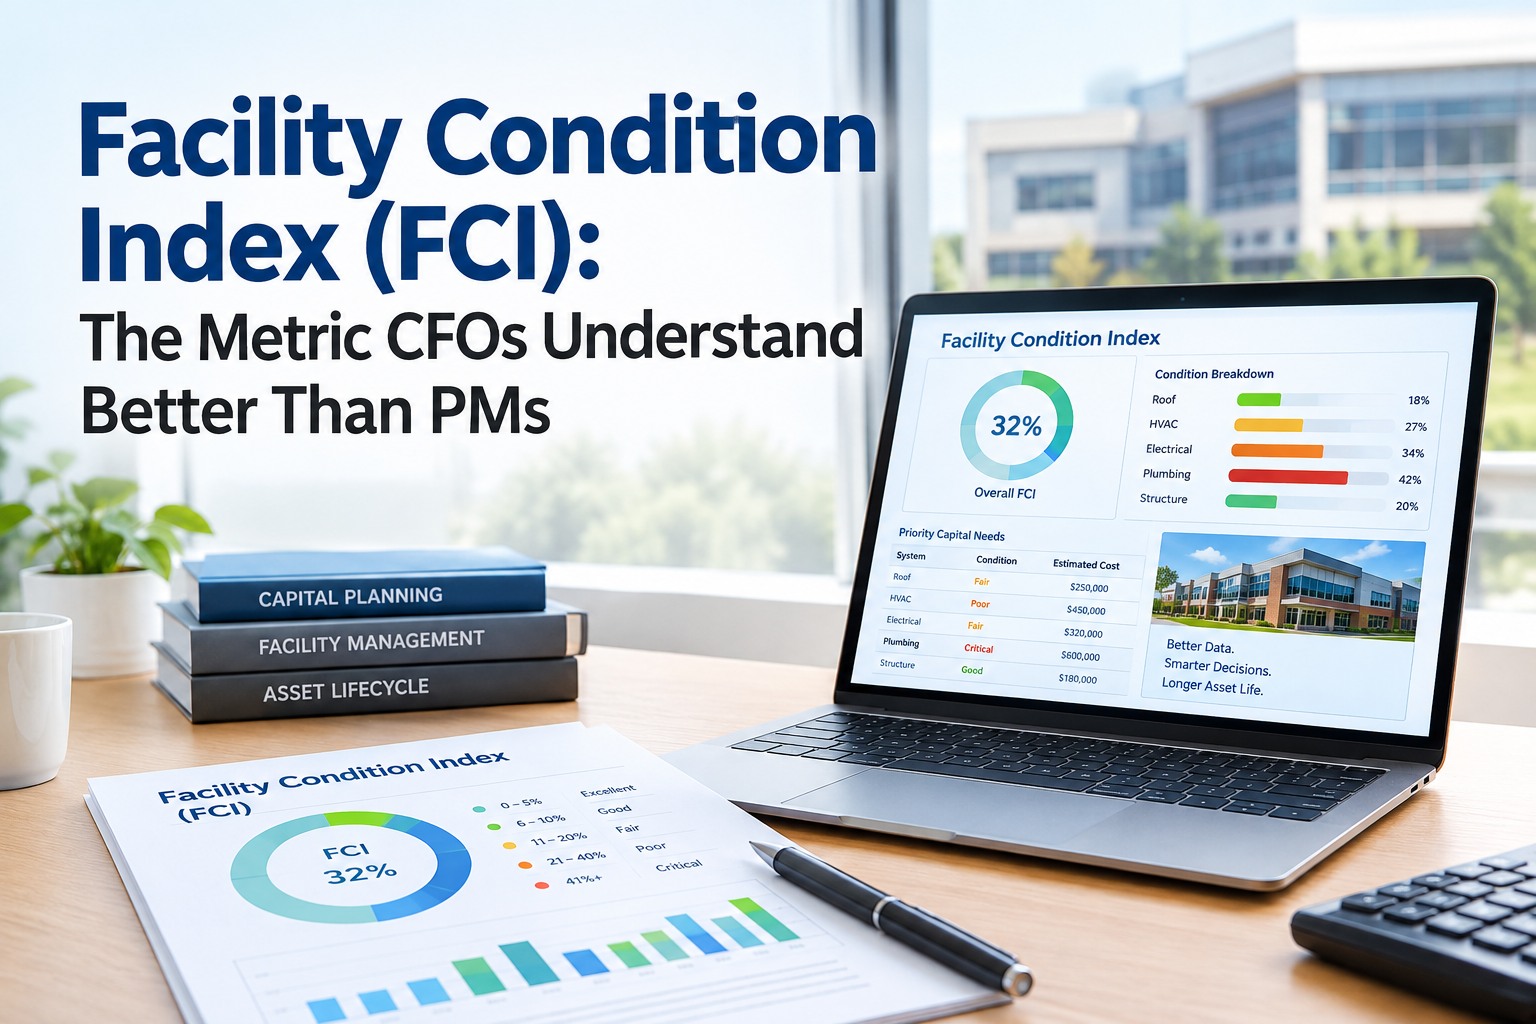
Facility Condition Index: The Metric CFOs Understand Better Than PMs
FCI turns your deferred-maintenance backlog into one percentage a CFO instantly reads. Learn to calculate it, benchmark it against the standard bands, and use it to turn a repair request into a funded capital plan.
Why the CFO Gets FCI Faster Than the PM Does
It sounds backwards, but the finance chair often grasps FCI quicker than the maintenance chair — because it's built from concepts finance lives in every day. Here's the translation that makes it click. Sign up free and OxMaint keeps both sides of that ratio accurate and current.
A backlog of failing assets
→
A liability as a % of asset value
"The roof needs replacing"
→
Risk quantified against replacement cost
A list that grows every year
→
A trend line heading toward a threshold
"We need repair money"
→
A capital case with a defensible number
The FCI Benchmark Bands
FCI only means something against the standard bands. These are the widely-used thresholds that turn your percentage into a verdict — and into a capital conversation. Find where your buildings sit. Book a demo to plot your portfolio on this scale.
Under 5%
Good
Well-maintained. Backlog is under control; routine reinvestment keeps it there.
5–10%
Fair
Watch closely. Deferral is accumulating; a plan is needed before it compounds.
10–30%
Poor
Significant risk. Major systems are aging out; capital intervention is overdue.
Over 30%
Critical
Replace-vs-repair territory. Backlog approaches the cost of a new asset.
Bands vary slightly by standard and asset type — use them as the shared language for a decision, not an exact grade. The direction of your FCI over time matters as much as the number.
A CFO Won't Fund a Backlog List. They'll Fund a Number Trending the Wrong Way.
The reason maintenance requests stall in budget meetings is that a list of repairs has no scale — the CFO can't tell urgent from routine. FCI gives the scale. When you can show a building crossing from Fair into Poor, and project where it lands in three years without funding, the ask stops being a plea and becomes risk management the CFO recognises. But the number is only as trustworthy as the backlog behind it — which has to be live, costed, and complete. That's what OxMaint keeps honest.
How to Calculate a Defensible FCI
The formula is trivial; the credibility is all in the inputs. A defensible FCI comes from getting these four steps right — because a CFO's first move is to test the number. Start free and build each input on real data.
1
Inventory the deferred backlog
Every deferred repair and renewal, captured and costed — not a gut estimate. Missing items understate FCI and destroy trust when found later.
2
Cost each item honestly
Realistic repair/replacement costs per deferred item, kept current. This is the numerator — vague costs make a vague, indefensible ratio.
3
Establish current replacement value
What it would cost to replace the asset today. This is the denominator — the anchor that makes the backlog a percentage, not just a dollar pile.
4
Divide, band, and trend
Backlog ÷ replacement value = FCI. Place it on the bands, and track it over time — the trend is what makes the capital case.
Using FCI to Win Capital
FCI is a reporting metric, but its real power is as a decision tool. Here's how facilities leaders turn the number into funded projects. Book a demo to see the reporting.
Prioritise the portfolio
Rank buildings by FCI to direct scarce capital where risk is highest — the worst-condition assets first, objectively.
Project the "do nothing" line
Show where FCI lands in 3–5 years without investment. A curve crossing into Critical is the most persuasive slide in the deck.
Trigger replace-vs-repair
When FCI passes ~30%, the data says stop repairing and replace — an objective trigger instead of an argument.
Report portfolio health
One dashboard the board reads at a glance — condition risk across every building, in a metric finance already trusts.
Spreadsheet FCI vs. OxMaint FCI
The formula is the same; whether the CFO trusts the number is not. Here's the difference between an FCI reconstructed once a year and one that's always current. Start free and build the trustworthy version.
How OxMaint Keeps Your FCI Honest
A trustworthy FCI is a by-product of running maintenance properly, not a report you build in a panic before budget season. Here's what keeps the number defensible. Sign up free to build it.
Live Deferred-Backlog Register
Every deferred repair sits as an open, costed work order — the numerator stays complete and current automatically.
Per-Asset Replacement Values
Replacement value held against each asset, so the denominator is anchored and the FCI is a real ratio, not a guess.
Drill-Down to the Work Order
Every FCI opens down to the individual repairs behind it — the answer when the CFO says "prove the number."
FCI Trend Tracking
Watch each building's FCI move over time and project the "do nothing" line — the heart of the capital case.
Portfolio Ranking
Sort every building by condition so capital flows to the highest-risk assets first, objectively.
Board-Ready Dashboards
Portfolio condition on one screen in a metric finance already understands — no manual assembly.
"
For years my capital requests died in the same meeting — I'd bring a list of repairs and the CFO's eyes would glaze over. The year I brought FCI instead, everything changed. I showed three buildings sitting at 8%, 14% and 22%, and projected the 14% one crossing into Poor within two years if we kept deferring. The CFO didn't need a maintenance lecture — she read the ratio, saw the trend, and funded the plan in the room. The metric did what a decade of repair lists couldn't. And because the backlog lived in OxMaint, when she asked me to prove the 22%, I clicked straight into the work orders behind it.
Director of Facilities · Multi-Site Property Portfolio
Frequently Asked Questions
What is the Facility Condition Index?
FCI is your deferred-maintenance backlog divided by the asset's current replacement value, expressed as a percentage. A lower FCI means better condition; it lets you compare buildings and quantify condition risk in one number.
What is a good FCI score?
Generally, under 5% is good, 5–10% fair, 10–30% poor, and over 30% critical. Bands vary by standard and asset type, so use them as a shared decision language — and watch the trend, not just the single number.
Why do CFOs respond to FCI when they ignore repair lists?
Because FCI is built from finance concepts — a liability expressed as a percentage of asset value. It gives scale and risk in a ratio they already use, where a raw repair list has no context to tell urgent from routine.
When does FCI say to replace instead of repair?
Around 30% and above, the deferred backlog approaches the cost of a new asset, so continued repair stops making financial sense. It's an objective trigger for the replace-vs-repair decision rather than a judgement call.
How does OxMaint help with FCI?
It keeps the deferred backlog live and costed as open work orders, holds replacement value per asset, and lets you drill from any FCI down to the repairs behind it — so the number is defensible and board-ready.
Sign up free to build it.
Stop Bringing a Repair List. Bring the Number They Fund.
Use FCI plus OxMaint to express your backlog as the one metric a CFO instantly reads, benchmark every building on the standard bands, and turn a stalled repair request into a funded capital plan — with the work-order proof behind every point. Start free — no credit card, unlimited users, forever. Or book a demo.