Facility Maintenance Cost Benchmark Worksheet: Best CMMS

Connect with Industry Experts, Share Solutions, and Grow Together!

Join Discussion Forum
facility-maintenance-cost-benchmark-worksheet-best-cmms

A facility maintenance cost benchmark worksheet is where most FM budget defenses win or lose bottom-quartile facility organizations typically spend 40–60% more per square foot than top-quartile peers managing equivalent portfolios and the gap is almost always hidden inside reactive emergency premiums that never surface without a segmented cost line. 2025–2026 IFMA and BOMA benchmarks put commercial office maintenance at a $2.15/sqft median (budget target $1.60–$2.80), heavy manufacturing at $4.80–$5.50/sqft median with best-in-class under $4.20, and healthcare at $12–$25+/sqft due to regulatory intensity. The most useful worksheet isn't a static template — it's one that auto-populates from a CMMS and flags variances against the correct benchmark for your facility type. Book a Demo to see OxMaint's benchmark dashboard running against your actual work-order history — cost per sqft, planned ratio, and staffing ratio all live.

Facility Management · Cost Benchmark · CMMS 2026

Facility Maintenance Cost Benchmark Worksheet: Best CMMS

Free 2026 maintenance cost benchmark worksheet — office, retail, healthcare, industrial — plus the CMMS software that auto-populates your data against every benchmark line automatically.

$2.15
2025–2026 IFMA/BOMA median for commercial office maintenance, per sqft, annually
40–60%
Cost gap between bottom-quartile and top-quartile FM operations on equivalent portfolios
> 65%
Planned maintenance ratio target — below 50% indicates excessive firefighting
16%
Top-quartile reactive emergency work order ratio (vs industry average that runs much higher)

2026 Benchmarks by Facility Type — The Reference Grid

Before benchmarking your facility, know which row applies. A hospital cannot be compared to a warehouse; a Class A office cannot be compared to a Class C. Below is the reference grid built from 2025 IFMA, 2024 BOMA, and Plant Engineering KPI datasets. Start a free OxMaint workspace and load your facility type against these benchmarks in one sitting — OxMaint auto-flags variance against the correct row based on your building classification.

Facility Type
Median $/sqft
Best-in-Class
Red-Flag Threshold
Planned Ratio Target
Commercial Office (Class A)
$2.15
< $1.80
> $3.20
65%+
Heavy Manufacturing / Industrial
$4.80–$5.50
< $4.20
> $6.50
68%+
Healthcare / Hospitals
$12–$25+
Below-median regulatory-compliant
Depends on service mix
70%+
Retail / Multi-Site
$1.20–$2.50
Leaderboards > 55% planned
Reactive-dominant > 50%
55%+
Distribution Center / Warehouse
$3.80 median
< $3.20
> $5.20
60%+
Educational / K-12 & Higher Ed
$2.50–$4.00
< $2.80
> $4.50
60%+

The Benchmark Worksheet — Fill In, Compare, Act

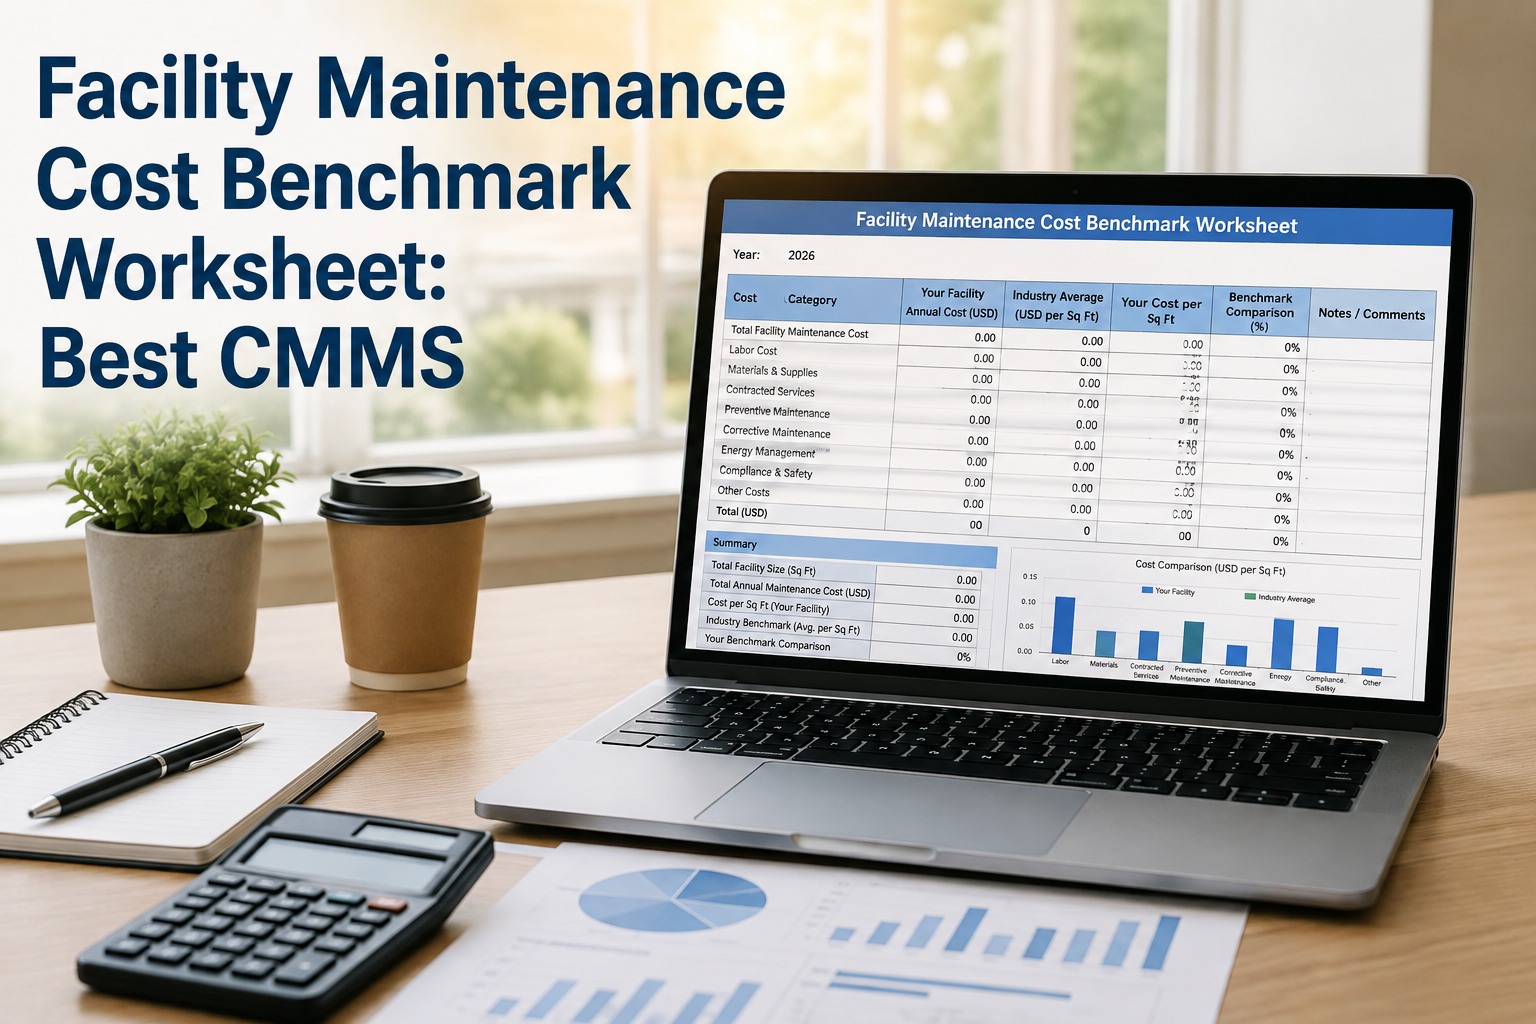
Below is the exact worksheet shape OxMaint auto-populates from work-order data. Enter your facility's numbers in the "Your Value" column, and each row shows the applicable benchmark and the variance state. Green means at or better than benchmark; amber means investigate; navy means immediate action. Book a live demo to see the auto-populated version running on a real facility's CMMS data — an OxMaint engineer walks the variance triage against benchmark exceptions during the call.

FACILITY MAINTENANCE COST BENCHMARK WORKSHEET · 2026
Auto-populated in OxMaint · Static PDF template available on signup
Metric
Your Value
Benchmark
Status
Maintenance $ per sqft (annual)
$_____
Facility-type median
▶ At benchmark
Planned maintenance ratio (%)
___%
> 65% target
▶ Below target
Reactive emergency work orders (%)
___%
Top-quartile: 16%
▶ Investigate
Staffing (FTE per 100k sqft)
___
0.8–1.5 warehouse
▶ In range
Mean Time To Repair (MTTR) hrs
___
< 4 hrs critical assets
▶ Above target
Contractor spend share of total (%)
___%
Site-specific
▶ Documented
Energy cost per sqft (annual)
$_____
IFMA regional median
▶ Review
Deferred maintenance backlog ($)
$_____
< 2% of replacement value
▶ Excessive
Every row above becomes a live tile on the OxMaint dashboard the moment your work orders start closing — no manual entry, no month-end reconciliation, no comparison spreadsheet.

The 4 Cost Categories Every Worksheet Must Split

A single "maintenance cost" line hides the leverage. Splitting spend into four category buckets exposes exactly where the reactive premium is inflating the total — and which lever moves it fastest. Below are the four segments the worksheet enforces. Sign up free and OxMaint auto-categorizes every work order into these four buckets as it closes — the split appears on your dashboard within the first month of data.

01
Planned PM Labor + Parts
Scheduled work orders — the healthy majority of a mature program. Target: > 65% of total spend, delivered at standard labor rates.
02
Reactive Emergency Response
Unplanned breakdowns. The hidden inflator — reactive events typically run 4.8× the cost of the same job planned. Target: < 16% of total.
03
Contractor / Vendor Spend
Third-party trade work, specialty services, and outsourced repairs. Track split vs in-house to catch vendor overlap and rate creep.
04
Deferred Maintenance Backlog
Known-but-unfunded work. Should stay below 2% of replacement value. Rising backlog is the earliest warning of future emergency cost.

A Spreadsheet You Update Once a Year Is Not a Benchmark.

Static worksheets get filled in for board review and forgotten by the next quarter. OxMaint's live benchmark dashboard updates every metric as work orders close — so the number the CFO sees is the number the shift closes on.

Manual Worksheet vs. Auto-Populated CMMS Benchmark

A static PDF worksheet gets FM teams to a defensible budget once. A live CMMS-driven benchmark keeps them at defensible every month, every audit, every capital request. Here is what changes when the worksheet becomes a live dashboard. Schedule a working session to migrate your current facility budget worksheet into OxMaint's benchmark dashboard — most teams see live variance flags in their first week of closed work orders.

Dimension
Manual PDF/Excel Worksheet
OxMaint CMMS Benchmark Dashboard
Data source
Manual entry from invoices + memory
Auto-populated from closed work orders
Update cadence
Annual budget cycle
Live — every work order closure updates KPIs
Benchmark match
Copied once from published tables
Auto-selected by facility type + region
Variance flags
Manual highlight, if noticed
Auto-alert when metric crosses red-flag threshold
Segmentation
Single line — no category split
Planned / Reactive / Contractor / Deferred split live
Budget defense
Assembled under deadline pressure
One-click export to board-ready format
"

We spent every February assembling a maintenance budget benchmark spreadsheet from three years of invoices, and the number always looked defensive because it was — we'd been running at $3.60 per sqft on a portfolio of Class A office space where the IFMA median was $2.15. We couldn't see where the delta was until OxMaint auto-split our closed work orders into planned versus reactive. Our reactive share was over 40%, twice the top-quartile. Within nine months of shifting to structured PM schedules, we were at $2.70 per sqft with reactive share under 20%. The worksheet stopped being an annual exercise and started being how we run the portfolio.

Director of Facilities · Multi-Site Commercial Real Estate Portfolio · 2.1M sqft · Northeast USA

Frequently Asked Questions

What's a good maintenance cost per square foot for an office building?
IFMA and BOMA 2025–2026 data puts the median around $2.15/sqft for commercial Class A office space, with a reasonable budget target of $1.60–$2.80/sqft. Spend significantly above $3.20/sqft is usually a signal that reactive-repair premiums are inflating the number.
Why does healthcare cost so much more per square foot?
Healthcare facilities run $12–$25+/sqft due to regulatory intensity, 24/7 operating hours, life-safety systems, specialized environmental controls (surgical suites, isolation rooms), and equipment complexity. The benchmark is not directly comparable to office or industrial figures.
What planned maintenance ratio should we target?
Industry best practice targets above 65% planned work orders as a share of total. Below 50% indicates a reactive-dominant program. Top-quartile FM operations consistently deliver above 70% planned while spending below the median $/sqft.
How does OxMaint auto-populate the benchmark worksheet?
OxMaint reads every closed work order — labor hours, parts spent, contractor invoices, planned vs reactive tag — and rolls the data into the four benchmark categories in real time. The dashboard updates with every closure, so the numbers are never stale.
Is the worksheet template really free?
Yes. The static PDF template downloads free from the OxMaint signup — plus the live version auto-populates in the free workspace as soon as work orders start closing. No CAPEX, no consulting engagement.
Can OxMaint benchmark multiple facilities on one dashboard?
Yes. Multi-site portfolios roll up on a single benchmark view — cost per sqft, planned ratio, and staffing ratio compared across every facility with the applicable IFMA/BOMA benchmark row applied per facility type.

Turn a Once-a-Year Worksheet Into a Live Dashboard.

OxMaint auto-populates every line of the facility maintenance cost benchmark worksheet from closed work orders — cost per sqft, planned ratio, reactive share, staffing ratio, deferred backlog — with variance flags against the correct 2026 IFMA and BOMA benchmark row for your facility type.
By William Jerry

Experience
Oxmaint's
Power

Take a personalized tour with our product expert to see how OXmaint can help you streamline your maintenance operations and minimize downtime.

Book a Tour

Share This Story, Choose Your Platform!

Connect all your field staff and maintenance teams in real time.

Report, track and coordinate repairs. Awesome for asset, equipment & asset repair management.

Schedule a demo or start your free trial right away.

iphone

Get Oxmaint App
Most Affordable Maintenance Management Software

Download Our App