Facility Maintenance Cost Per Square Foot 2026: Benchmarks & FM Cost Guide

Connect with Industry Experts, Share Solutions, and Grow Together!

Join Discussion Forum
facility-maintenance-cost-per-square-foot-benchmarks-2026

A higher facility management cost per sq ft in 2026 isn't always a warning sign — it can be the clue that your site is finally surfacing the right work. The real question is whether that spend is building a smarter backlog or hiding a failure pattern you haven't ranked yet. This guide walks the benchmarks using OXMAINT AI, the AI-powered overlay that turns cost drift into ranked work orders.

Facility Management · Benchmarks · Ranked Work Orders

Facility Management Cost Per Sq Ft 2026: When a Higher Number Means a Smarter Queue.

OXMAINT AI overlays your existing EAM/CMMS — cost drift, repeat failures and PM misses get read as signals, diagnosed against asset history, ranked by risk and impact, and dispatched as work orders you can actually trust.

Detect → Diagnose → Prioritize → Dispatch Overlays Your Existing EAM/CMMS Directional 2026 Benchmarks
6 Types
building categories benchmarked from office to healthcare
4 Steps
detect, diagnose, prioritize, dispatch — the operating model
3 Signals
cost per sqft + work order pattern + asset condition, read together
0
new systems — Oxmaint AI overlays the EAM/CMMS you already run

What Cost Per Sq Ft Actually Means in 2026

Leaders searching this metric usually want a simple answer: are we overpaying? The better 2026 question is whether spend reflects the true complexity of the site, or whether you're drifting into reactive work that should have been prevented earlier. It typically includes maintenance labor, vendor calls, PM, corrective repairs, parts and compliance tasks — but on its own it doesn't tell you whether the building is healthy, under-maintained, or simply run at a higher standard than peers. Sign up free and baseline your first site.

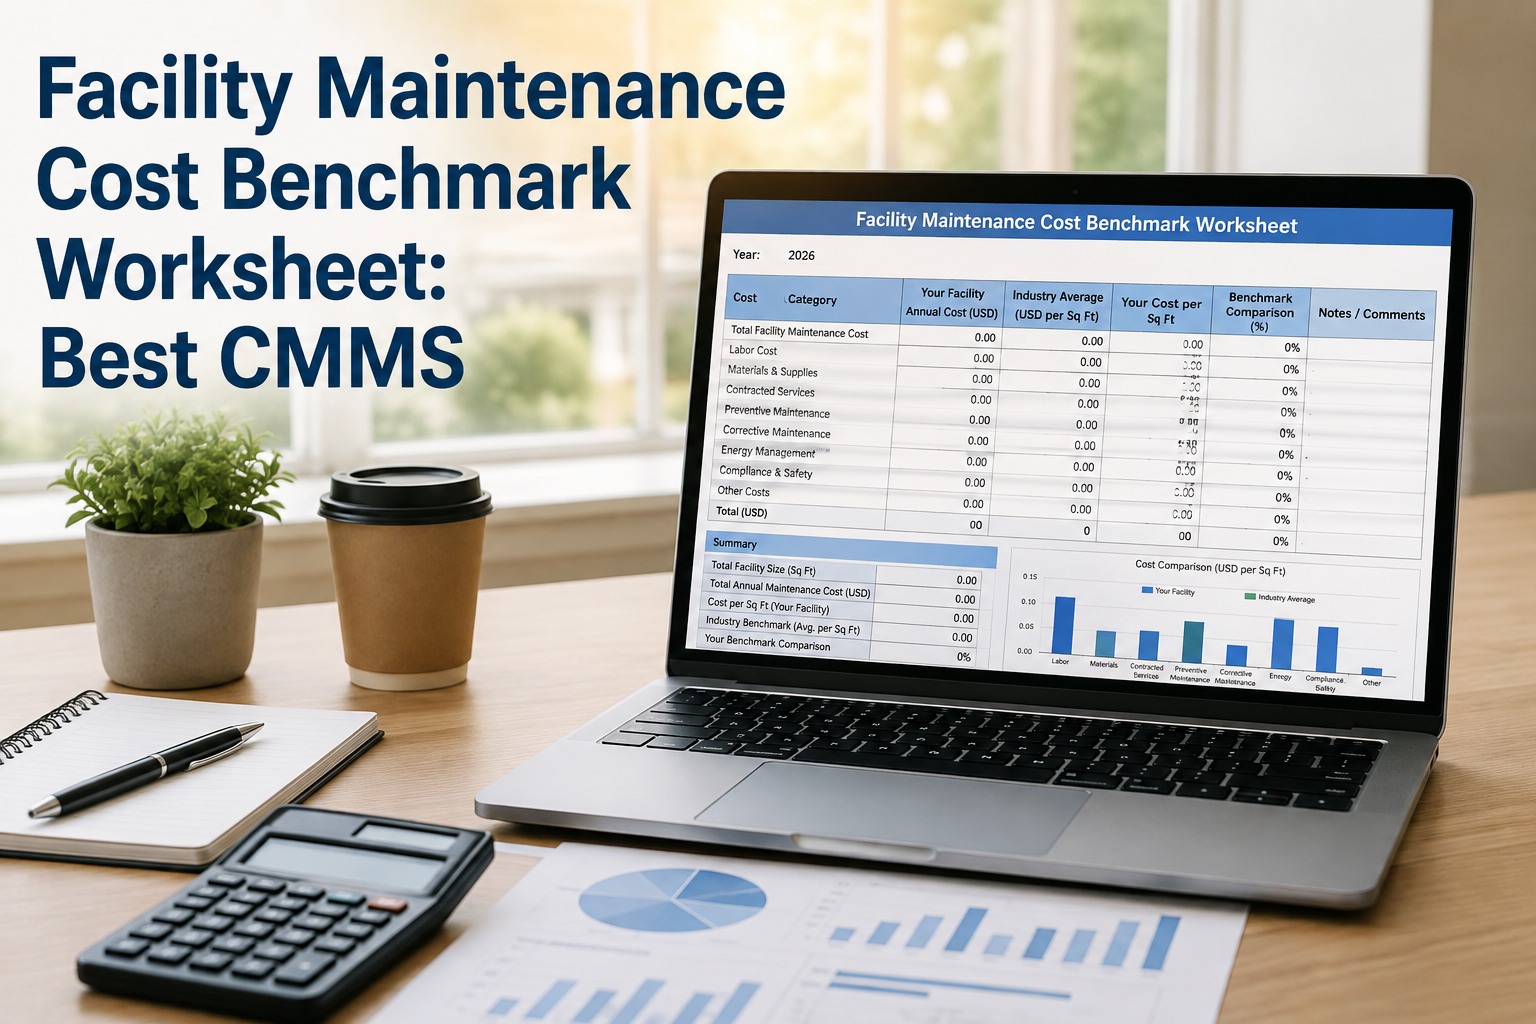
Honest 2026 Benchmark Ranges ($/sq ft)

Directional benchmarks for maintenance and facilities operations spend. Where ranges aren't sourced from a single public benchmark, they're labeled illustrative — use them to spot relative drift, not to claim universal truth. Book a demo to compare your site against these ranges.

Building TypeLowMedianHighWhy It Moves
OFFICE$1.25$2.50$4.25HVAC runtime, tenant responsiveness, after-hours service
INDUSTRIAL$0.75$1.50$3.00Dock equipment, roof condition, large footprint, fewer finishes
HEALTHCARE$4.50$7.50$12.00+Compliance, uptime, redundancy, critical systems
RETAIL$1.50$3.00$5.50Customer-facing uptime, lighting, HVAC, multi-site vendor loads
EDUCATION$1.75$3.50$6.50Seasonal occupancy, aging assets, envelope and HVAC scope
MIXED-USE$1.75$3.25$6.00+Scope variation, shared services, uneven service levels

Treat healthcare as the most defensible high-complexity benchmark category; the remaining ranges are directional and illustrative for 2026 planning. Use them to spot meaningful drift, not to prove the average.

Why a Higher Number Can Be a Better Signal

A rising cost per sq ft doesn't automatically mean waste — sometimes it means the site has finally become more observable. Sign up free and see what your own drift is telling you.

◆
Backlog Surfaces
Work invisible last quarter now shows up as recurring corrective work
◆
Inspections Get Consistent
Findings are being recorded reliably instead of skipped or summarized away
◆
Overdue PMs Get Captured
Missed preventive maintenance shows up instead of staying buried in a log
◆
Costs Get Normalized
Vendor and labor spend land in the same view instead of separate budgets

Read the Number Honestly — High and Low Both Cut Both Ways

A benchmark only means something with context. Book a demo to interpret your own site's number.

ABOVE AVERAGE
Can Still Be Well Run
Higher spend, defensible reasons
  • Higher uptime requirements
  • Stricter compliance obligations
  • Older equipment
  • More intensive service levels
  • A known catch-up period after deferred maintenance
BELOW AVERAGE
Can Still Be at Risk
Lower spend, hidden exposure
  • Deferring PM
  • Under-reporting failures
  • Hiding labor in other budgets
  • Delaying critical repairs
  • No visibility into true asset condition

A Compact Example: Cost Spike to Ranked Work Order Queue

Scenario: an office site sees a 14% rise in facilities spend per sq ft over two months, mainly from repeated rooftop unit callouts and overtime. Sign up free and run this scenario on your own data.

01
Detect
Repeat HVAC work orders on the same asset family, overtime rising in the same window, spend drifting above baseline
Signal: something is changing, not just costing more
02
Diagnose
The same RTU has three similar failures; PM tasks are being closed late; the pattern suggests airflow and sensor issues, not operator error
Narrows the cause before dispatch
03
Prioritize
1. RTU failure affecting occupied zones · 2. PM backlog on the same asset · 3. recurring sensor replacement · 4. lower-severity complaints
A ranked queue, not a flat list
04
Dispatch
Create the top work order, assign the right technician, attach history and failure context, schedule follow-up inspection
A budget metric becomes an operational decision

Don't Stop at the Number. Turn Drift Into a Ranked Queue.

Oxmaint AI reads cost drift, repeat failures and PM misses together — then ranks the work that actually deserves dispatch first.

Benchmark Drift That Should Become Work Orders This Quarter

When cost per square foot rises, these are the signals most likely to convert into ranked work. Book a demo to see these signals ranked live.

HVAC
Repeat Callouts
Especially when the same RTU, pump, sensor or AHU keeps reappearing
SAFETY
Life-Safety or Compliance Misses
Not "small" — they create exposure even at modest dollar value
PM
Recurring PM Failures
Late, incomplete or repeatedly reopened PM usually costs more later in corrective repairs
ENVELOPE
Roof & Envelope Defects
Water intrusion often turns into electrical, finish and indoor air quality work

Detect → Diagnose → Prioritize → Dispatch

1
Detect
Compare current spend, repeat failures and work order patterns against baseline — cost frequency, repeat assets, overtime load, inspection misses
2
Diagnose
Use maintenance history, asset age, location, vendor patterns and failure codes to find what's actually driving the drift
3
Prioritize
Rank by safety and compliance, business interruption risk, recurrence, cost severity, effort versus impact, SLA exposure
4
Dispatch
Create or update work orders, assign the right response path, track closure so the same issue stops reappearing

What OXMAINT AI Gives a Facility Team

Built to overlay the EAM/CMMS you already run — not replace it. Start free and load your first site into OXMAINT AI.

Cost Drift Detection
Surfaces changes in cost frequency, repeat assets and overtime load before they become a surprise.
Diagnosis Against History
Matches drift to maintenance history, asset age, location and failure codes.
Risk-Based Ranking
Safety, compliance, recurrence and SLA exposure — not just dollar value.
EAM/CMMS Overlay
Works on top of your current stack, no rip-and-replace project.
Portfolio Comparison
Compare a site against itself over time, or against similar sites in your portfolio.
Quarter-Ready Backlog
A queue that reflects real site condition, ranked for next quarter's planning.
"

Our cost per square foot went up and the first reaction was to panic. Once we looked at it next to the work order pattern, it was obvious — we were finally seeing the backlog that had been hiding for two years. Ranking it instead of just reacting to the number changed how we planned the whole quarter.

Facility Director · Multi-Site Portfolio

Frequently Asked Questions

What is a good facility management cost per sq ft in 2026?
There is no single "good" number. It depends on building type, service scope, compliance burden, uptime requirements and asset age.
Why might my facility cost per sq ft be higher than peers?
Common causes include aging assets, higher occupancy, stricter service levels, more emergency work, and deferred maintenance catching up.
Are these 2026 benchmark ranges exact?
No. The ranges are directional. Some are sourced from industry expectations, others are illustrative and intended for planning and relative comparison.
How do I turn cost drift into action?
Use Detect → Diagnose → Prioritize → Dispatch: identify the drift, find the likely cause, rank by risk and impact, then create the work orders that matter most. Book a demo to see this on your own site.
Does Oxmaint AI replace our CMMS or EAM?
No. Oxmaint AI is an overlay that works with your existing system and helps convert drift into ranked work order decisions. Sign up free and connect your EAM.

Benchmark Read. Drift Found. Backlog Ranked.

Don't stop at the cost-per-sqft number — see your site's drift turned into ranked work orders inside the EAM/CMMS you already use, with OXMAINT AI.
By Corin Hale

✨

Experience
Oxmaint's
Power

Take a personalized tour with our product expert to see how OXmaint can help you streamline your maintenance operations and minimize downtime.

Book a Tour

Share This Story, Choose Your Platform!

Connect all your field staff and maintenance teams in real time.

Report, track and coordinate repairs. Awesome for asset, equipment & asset repair management.

Schedule a demo or start your free trial right away.

iphone

Get Oxmaint App
Most Affordable Maintenance Management Software

Download Our App