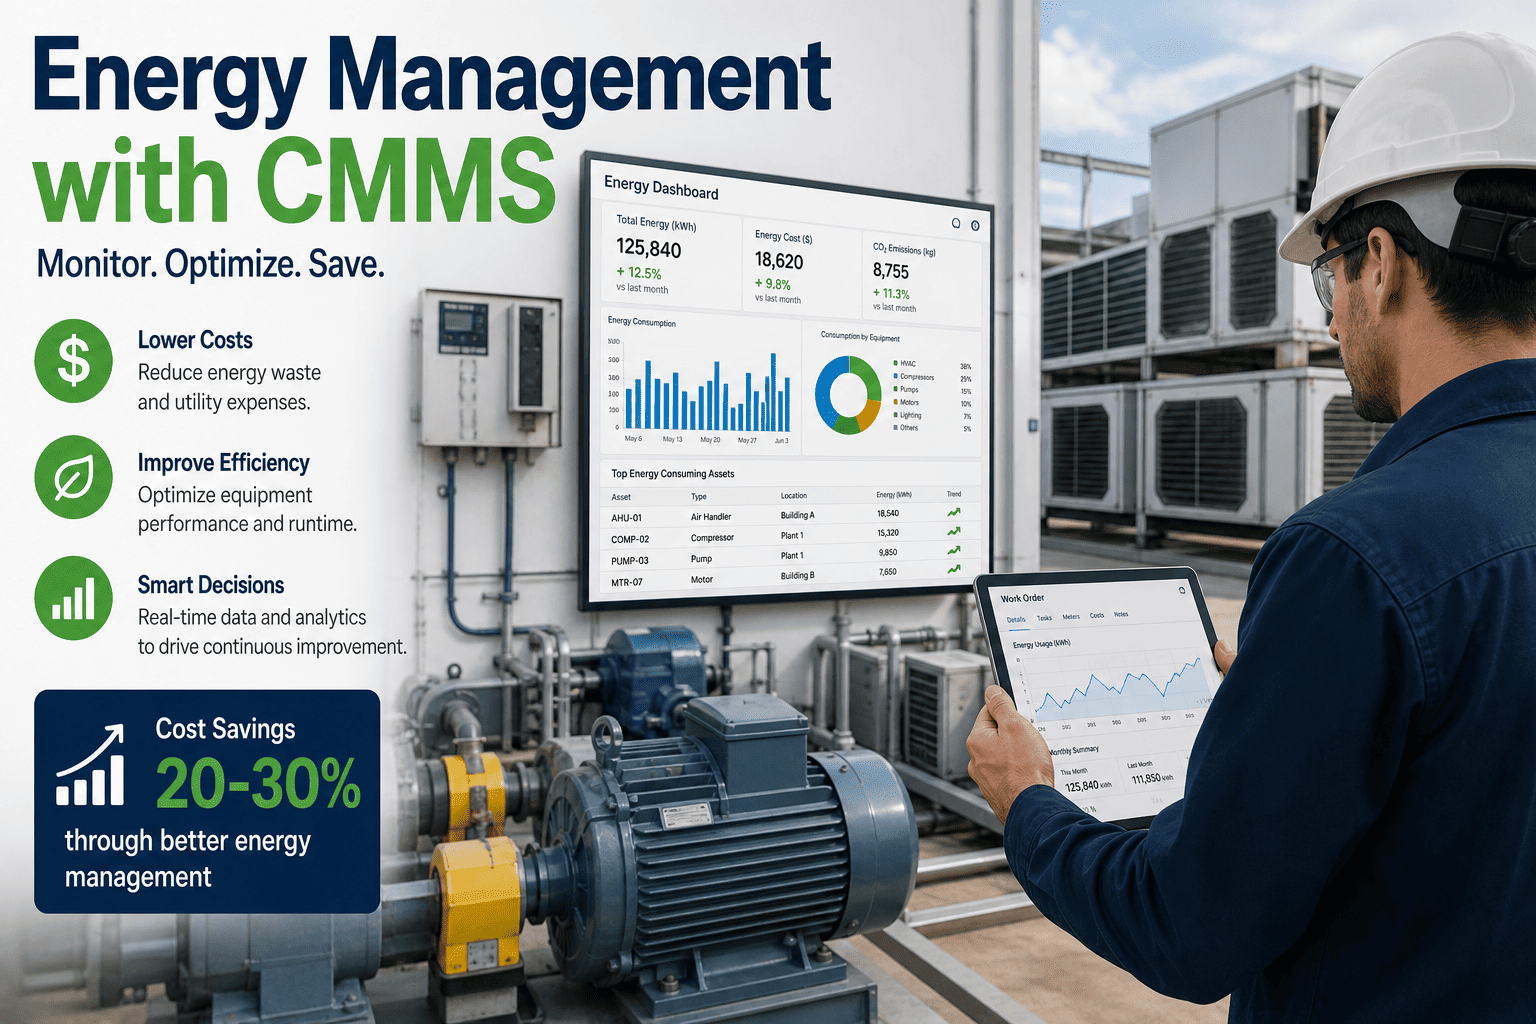
Energy is the second-largest operating cost in FMCG manufacturing after raw materials 15-25% of total operating spend on average, and $1.2M-$4M annually for a typical 5-line plant. Yet fewer than 12% of maintenance teams track energy consumption at the asset level, and that blindspot is where the money leaks: compressed air systems losing 25-30% of output through undetected leaks, refrigeration compressors running 15% harder than necessary due to condenser fouling, steam traps failing open for months at $5-15K each, and 100HP motors quietly slipping from 95% to 82% efficiency at a cost of $4,700 per motor per year. Multiply that across a plant with 50-200 motors and energy waste from degraded maintenance alone reaches $180K-$470K annually — before you touch capital investment. This is a maintenance problem, not a CAPEX problem, and plants that treat it as such cut utility costs 10-20% within 12 months. This guide covers FMCG plant energy management the way a modern reliability-driven operation runs it — the energy consumption map, the four highest-impact utility systems, the quick-win project sequence, and how OxMaint CMMS ties energy KPIs directly into your PM workflow. Start free or book a demo to see the energy-maintenance loop live.
FMCG · Energy Management · Maintenance · CMMS 2026
FMCG Plant Energy Management & Maintenance CMMS Guide
Energy management through maintenance for FMCG plants: motor efficiency programs, compressed air optimization, refrigeration efficiency, and CMMS-based energy KPI tracking that consistently moves plant energy performance downward.
15-25%
Share of FMCG plant operating cost consumed by energy
10-20%
Utility cost reduction achievable in 12 months with no CAPEX
25-30%
Typical compressed-air output lost to undetected leaks
<12%
Share of maintenance teams tracking energy at asset level
Where the Energy Actually Goes — FMCG Consumption Map
Before you can cut it, you have to see it. Most FMCG plants know their monthly utility bill and nothing else — no per-asset breakdown, no top-consumer ranking, no efficiency trend. But the consumption pattern in food, beverage, personal care, and household product manufacturing is remarkably consistent, and once you know where the load sits, you know where to attack first. Below is the typical FMCG plant energy split. Sign up free and OxMaint's FMCG library ships with per-asset energy tracking templates for refrigeration, HVAC, compressed air, and motor systems — your first sub-metered dashboard lives in your workspace within the first shift.
TYPICAL FMCG PLANT ENERGY CONSUMPTION SPLIT
Refrigeration & HVAC
Cold storage, process cooling, cleanroom conditioning
Compressed Air
Packaging, actuators, cleaning, pneumatic conveying
Motors & Drives
Pumps, fans, conveyors, mixers, grinders
Thermal / Steam
Boilers, CIP heating, pasteurization, sterilization
Lighting & Other
Production floor lighting, office, IT, security
Ranges reflect food, beverage, personal care, and household product plants. Your specific split depends on process mix — the point is that four systems account for 90%+ of the load, and each is heavily maintenance-driven.
The 4 Highest-Impact Utility Systems — What Maintenance Actually Controls
Every FMCG plant's energy program lives or dies on four systems. Below is the impact map, showing the typical baseline waste, the maintenance intervention that recovers it, and the payback period plants report. Book a 30-minute demo and an OxMaint FMCG specialist will map your specific plant's four systems against these benchmark savings before you open a trial — you'll leave the call knowing which system pays back first at your site.
❄
SYSTEM 1
Refrigeration & HVAC
Baseline Waste15% over-consumption from condenser fouling & refrigerant loss
Maintenance FixCondenser cleaning cadence, refrigerant charge verification, defrost scheduling
Typical Saving20-35% refrigeration energy reduction
Payback60-90 days on maintenance interventions alone
Baseline Waste25-30% of output lost to leaks — 7-8x the cost of electrical energy
Maintenance FixUltrasonic leak survey, pressure setpoint audit, dryer PM
Typical Saving18-28% within 90 days · $80K-$220K per 100 CFM installed
PaybackImmediate — leaks tagged today, cost recovered next month
Baseline Waste5-15% efficiency drop over life — bearing wear, misalignment, winding degradation
Maintenance FixCurrent-draw trending, alignment PMs, VFD tuning on variable loads
Typical Saving$4,700/yr per 100HP motor at 82% → 95% efficiency recovery
PaybackVFD retrofits 12-18 months · trending starts saving immediately
Baseline Waste15-30% of steam traps failed open at any time · flue-gas excess air >20%
Maintenance FixTrap testing cadence, boiler combustion tuning, insulation survey
Typical Saving$5K-$15K per failed trap replaced · 5-10% boiler fuel saving from tuning
Payback30-60 days on trap program · combustion tuning immediate
The Energy KPI Set — What to Actually Measure Per Asset
You can't manage what you don't measure, and you can't measure at the plant level and get any actionable signal. The whole game is asset-level KPIs, trended against a known-good baseline, with alerts firing when efficiency drifts. Below is the KPI set every energy-conscious FMCG maintenance program tracks. Sign up free and OxMaint's PM templates for FMCG assets already include the energy KPI capture step — "record kW draw at current load" on compressor PMs, "record approach temperature" on chillers, "record current vs nameplate" on motors — so the energy data starts building from your very first PM.
01
Specific Energy Consumption (kWh/unit)
Energy per unit of production output — the truest measure of plant efficiency, normalized against volume. Trended weekly and monthly to catch drift.
02
Compressor kW Draw at Load
Recorded on every compressor PM. Rising kW at the same output flags leaks, dryer issues, or intake filter loading — weeks before a failure.
03
Chiller / Compressor Approach Temperature
Difference between refrigerant and cooled fluid. Widens as condenser or evaporator fouls — direct efficiency signal that predates the utility bill spike.
04
Motor Current vs Nameplate
Recorded quarterly on top energy-consuming motors. Rising current at same load = bearing wear, misalignment, or winding degradation — energy AND reliability signal in one reading.
05
Steam Trap Fail Rate
Percentage of traps failed open on annual test. Industry norm is 15-30% failed at any time. Target: <5% through cadenced testing and replacement.
06
Peak Demand kW & Load Factor
Utility charge is often more about peak than total consumption. Load-shifting non-critical work off peak windows cuts demand charges 15-25%.
The First Ultrasonic Leak Walk Pays for the Whole Energy Program.
Two technicians, one day, one ultrasonic detector = $15K-$30K in annual waste identified before lunch. The economics of maintenance-driven energy management are absurdly good — but they only work if the findings become work orders, the fixes get tracked, and the savings get measured. OxMaint closes that loop from the first leak tag through verified kWh recovery.
The 90-Day Quick-Win Sequence — Where to Start Monday
Energy programs stall when they try to boil the ocean. The plants that actually cut 10-20% of utility spend in year one all start the same way — five sequential moves, each with defined cost, effort, and expected saving. Book a scoping call and an OxMaint engineer will walk this sequence against your specific plant — you'll leave with an ordered action list and expected savings ranges before you commit to a trial.
Week 1
Ultrasonic Compressed Air Leak Survey
Two techs, one day, ultrasonic detector. Walk every air line, tag every leak, log in CMMS. Fix top 20 largest leaks immediately. Typical result: $15K-$30K annual waste identified in day one.
Week 2-3
Steam Trap Full-Plant Test
Test every trap in the plant (typically 50-200). Replace all failed-open traps. Establish 6-month test cadence going forward. Expected saving: $5K-$15K per failed trap replaced.
Week 4-6
Top-30 Asset Sub-Metering
Install current monitoring on the 30 highest-energy assets. Establish baseline consumption profiles at known-good condition. Enables per-asset degradation detection going forward.
Week 7-10
Refrigeration & HVAC Deep-Clean
Condenser coil cleaning, refrigerant charge verification, filter replacement, control setpoint review. Typical saving: 20-35% refrigeration energy reduction, 60-90 day payback.
Week 11-13
Boiler Combustion Tuning & Insulation Audit
Flue-gas analysis, excess-air adjustment (target <15%), pipe/tank insulation gap survey. Combustion tuning alone often yields 5-10% fuel saving with no capital cost.
Utility-Bill Reporting vs. OxMaint Live Energy-Maintenance Loop
Most FMCG plants "manage" energy through a monthly utility bill review. That's the maintenance equivalent of managing reliability through the annual insurance premium — a lagging indicator that arrives too late to change anything. Here's what shifts when the energy KPIs live inside OxMaint alongside the work orders that drive them. Start free — no credit card, unlimited users so every technician can log energy readings on the PMs they run, and the FMCG library ships with the KPI capture steps already built into the PM templates.
Plants that put the energy KPI on the same screen as the PM don't just save money — they hit ESG targets, extend equipment life, and give the CFO defensible numbers on maintenance ROI. Start your free forever workspace to build your first energy-maintenance dashboard this week, or book a demo to see a live customer FMCG dashboard before you commit.
"
Our monthly energy bill review was the extent of our program — we knew we were spending too much, but every capital request to fix it got pushed. When we moved PMs onto OxMaint and started capturing kW draw and motor current on every routine, the biggest surprises weren't the compressors or chillers — it was a bank of 40HP pump motors on the CIP skid running at 74% efficiency after seven years. Zero downtime events, but they were bleeding roughly $9K each per year in wasted electricity. First 12 months we cut plant utility spend by 14% with almost no capital — mostly ultrasonic leak fixes, condenser cleanings, and one round of motor replacements the CMMS data justified on ROI alone.
Site Reliability Manager · Personal-Care FMCG Plant · 4-Line Operation · Southeast Asia
Frequently Asked Questions
What percentage of FMCG operating cost is energy?
Roughly 15-25% of total operating cost across most FMCG segments, and 8-12% specifically for food, beverage, and personal-care manufacturing depending on the process mix. For a mid-size 5-line plant that typically translates to $1.2M-$4M annually. Refrigeration and HVAC dominate the split (35-50% of facility energy), followed by compressed air (20-30%), motors and drives (15-25%), and thermal/steam systems (10-20%).
How much can maintenance-driven energy management save without CAPEX?
Plants that implement systematic energy-focused maintenance — ultrasonic leak surveys, steam-trap testing, condenser cleaning, motor current trending, boiler combustion tuning — typically cut utility costs 10-20% within 12 months with no significant capital investment. The savings compound: a mid-size plant at $2M annual energy spend saves $200K-$400K in year one alone.
Sign up free to start tracking recoverable waste from day one.
Why is compressed air the most expensive utility?
Compressed air costs 7-8x more per unit of energy delivered than direct electrical power because generation, drying, storage, and distribution are all inefficient. Add to that the 25-30% typical leak losses in most FMCG plants, and every 100 CFM of installed compressor capacity is wasting $80K-$220K per year in energy that never does useful work. Leak surveys are the single highest-ROI action in any energy program.
Do we need to install new sub-metering hardware to start?
No — the entry point is capturing manual energy readings during existing PMs (kW draw at compressor PM, current at motor PM, approach temp at chiller PM). Sub-metering on the top-30 highest-consuming assets typically comes in phase 2, week 4-6 of a structured program. OxMaint accepts both manual PM captures and sub-metered feeds via API or CSV import — no rip-and-replace of your existing infrastructure.
Can OxMaint generate ESG and sustainability reports?
Yes. Every energy-saving intervention in OxMaint links pre- and post-baseline consumption, verified kWh reduction, and cumulative savings — exportable as an auditable ESG and sustainability package aligned to ISO 50001 and internal corporate targets.
Book a demo to see the ESG reporting workflow live.
How does OxMaint compare motor efficiency vs nameplate?
Motor PMs in OxMaint capture current draw and operating load, compared to nameplate ratings stored in the asset record. A rising trend at the same output signals bearing wear, misalignment, or winding degradation — often 5-15% efficiency drops over life. Plants use these trends to justify motor replacement or VFD retrofits with hard ROI data, not gut feel.
Is a credit card or CAPEX approval needed to start?
No. OxMaint's free forever plan requires no credit card, no CAPEX request, and no consulting engagement — you can
sign up in under 2 minutes and have your first FMCG assets, energy KPI capture PMs, and reporting dashboards live the same shift. FMCG plant asset templates ship pre-built.
Turn Every PM Into an Energy Data Point.
OxMaint captures kW, current draw, and approach temperature on every routine PM — so degradation, leaks, and efficiency drift show up in the trend chart weeks before they hit the utility bill. Start free — no credit card, unlimited users, forever. Or book a demo for a plant-specific savings projection before you sign up.