Every unplanned production stoppage in manufacturing costs more than the repair. It costs the production run that was interrupted, the overtime to recover schedule, the customer relationship affected by a late shipment, and the expediting premium on emergency parts. Research consistently puts the fully-loaded cost of reactive maintenance at 4.8 times the cost of the same intervention planned in advance. Yet most manufacturing facilities still operate with more than 60% of their maintenance spend in reactive mode — not because predictive maintenance is unavailable, but because the data and systems infrastructure to make it operational has not been put in place. Start a free trial to see how Oxmaint enables predictive maintenance in manufacturing settings, or book a demo and walk through a real manufacturing PM workflow.
Predictive Maintenance · Manufacturing Cost Analysis
Predictive vs Reactive Maintenance in Manufacturing: Cost Comparison
A data-driven comparison of predictive and reactive maintenance strategies in manufacturing — covering per-event cost differences, downtime impact, ROI calculation models, and the operational infrastructure required to move from reactive to predictive operations.
4.8x
Higher cost of reactive emergency repair versus the same maintenance intervention planned in advance
$260K
Average annual unplanned downtime cost for a mid-size manufacturing facility with 50–100 production assets
38%
Average reduction in total maintenance cost within 18 months of deploying structured predictive maintenance programs
10:1
Typical ROI ratio for predictive maintenance investment — $10 saved per $1 invested in sensor and CMMS infrastructure
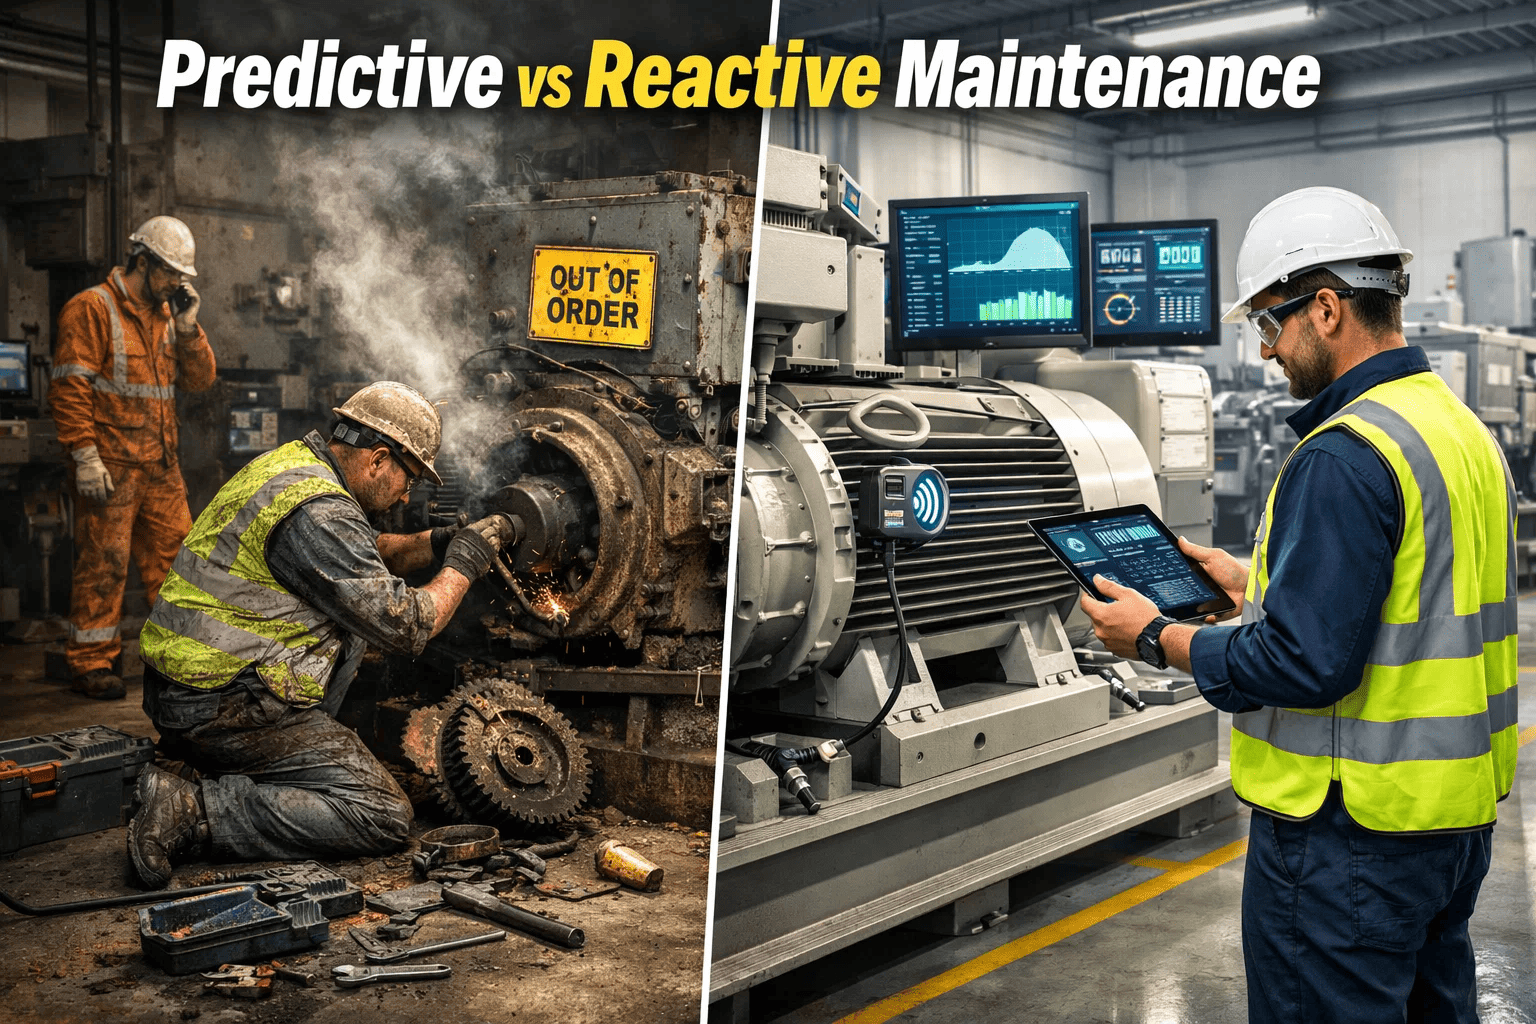
Defining the Two Strategies
Reactive Maintenance
Run to Failure
Equipment is operated until it fails or requests maintenance through an alarm or operator observation. No advance planning for parts, technician availability, or production impact. Emergency response is the standard operating mode. Failure events determine the maintenance calendar.
Average cost per event: 4.8x planned equivalent
Preventive Maintenance
Calendar-Based Servicing
Maintenance performed on a fixed schedule — monthly, quarterly, annually — regardless of actual asset condition. Prevents some failures but over-maintains assets in good condition and under-maintains assets deteriorating faster than the schedule assumes. Industry average: 12–18% unnecessary PM cost from over-servicing.
Average cost per event: 1.8x predictive equivalent due to over-servicing
Predictive Maintenance
Condition-Based Intervention
Maintenance triggered by actual asset condition data — vibration trends, temperature deviation, oil analysis results, current draw anomalies. Work is performed when and only when an asset shows deterioration approaching the failure threshold. Eliminates both over-servicing and run-to-failure costs.
Lowest per-event cost with highest failure prevention rate of any strategy
Prescriptive Maintenance
AI-Recommended Action
The leading edge of predictive — AI not only detects deterioration but recommends the specific maintenance action, optimal timing considering production schedule, and expected outcome. Reduces the cognitive burden on maintenance engineers and optimises the intervention decision across competing operational constraints simultaneously.
Emerging: 15–22% additional ROI over standard predictive maintenance in mature deployments
Oxmaint Enables Condition-Based Maintenance Without a Six-Month Implementation
Asset condition scoring, IoT integration, sensor-triggered PM work orders, and manufacturing downtime analytics — all in one platform built for production environments.
The Real Cost Breakdown: Reactive vs Predictive per Failure Event Type
| Asset / Failure Type |
Reactive Maintenance Cost |
Predictive Maintenance Cost |
Annual Savings per Asset |
| Production Motor (75kW) |
$18,000–$32,000 emergency replacement + 16hr downtime |
$2,800 bearing replacement at first vibration alert |
$15,200–$29,200 per prevented failure event |
| Industrial Gearbox |
$45,000–$90,000 — gear damage propagates to housing and shaft |
$6,000–$12,000 gear set replacement at oil analysis signal |
$39,000–$78,000 per prevented catastrophic failure |
| Centrifugal Pump |
$8,500 emergency repair + $22,000 production loss (8hr line stop) |
$1,800 seal and impeller service at cavitation detection |
$28,700 per prevented failure at production line level |
| Air Compressor System |
$14,000 emergency rebuild + 12hr multi-line shutdown |
$3,200 valve and filter service at pressure ratio trend |
$10,800 + full plant downtime cost avoided per event |
| CNC Spindle (machining) |
$28,000 bearing replacement + $55,000 production loss (24hr stop) |
$4,500 bearing replacement at vibration spectrum alert |
$78,500 per prevented failure on a dedicated machining cell |
| Conveyor Drive System |
$9,800 emergency repair + $18,000 downstream line impact |
$2,100 drive service at load cell anomaly detection |
$25,700 per prevented failure for integrated conveyor system |
The Total Cost of Reactive Maintenance: Beyond the Repair Bill
A
Emergency Contractor Premium
Emergency call-out rates for specialist maintenance contractors run 60–120% above planned work rates. Weekend and overnight callouts attract additional penalty rates. A repair that costs $3,200 planned costs $5,800–$7,400 when triggered at 2AM on a Saturday.
Average premium: 85% above planned work rate
B
Parts Expediting Cost
Reactive failures require immediate parts that are rarely on the shelf. Expedited freight for critical parts adds $400–$2,800 per event for next-day delivery. Some parts require 2–3 week lead times, extending the downtime cost window significantly beyond the repair itself.
Average expediting premium: $1,100 per reactive repair event
C
Cascading Damage Amplification
When a bearing fails reactively, the failure mode propagates — shaft scoring, housing damage, seal failure, and in severe cases, motor or gearbox damage from thermal and mechanical overload. The repair scope expands from $3,000 to $22,000 during the failure-to-detection window.
Cascading damage adds 2.4x to average reactive repair scope
D
Production Revenue Loss
At a manufacturing facility running $8,000/hour of contribution margin, a 16-hour unplanned line stoppage costs $128,000 in lost production before the first hour of labour is invoiced. For job shop and batch manufacturers, the schedule disruption cascades across multiple subsequent orders.
Production loss accounts for 68% of total reactive incident cost
How Oxmaint Enables Predictive Maintenance in Manufacturing
1
Asset Registry with Condition Scoring
Every production asset is registered with make, model, criticality classification, and baseline condition data. Condition scores update from inspection results, sensor readings, and maintenance history — giving each asset a live health rating that drives maintenance prioritisation.
2
IoT and Sensor Data Integration
Vibration sensors, temperature monitors, current transformers, and process historians connect to Oxmaint via API or MQTT. Sensor readings are linked to the specific asset they monitor — creating the real-time condition data stream that drives predictive triggers.
3
Condition-Based PM Triggers
Maintenance work orders are generated when sensor readings cross defined thresholds or when trend deviations exceed baseline envelopes — not on a fixed calendar. A motor showing a 12% vibration increase over 14 days generates a work order automatically before the bearing fails.
4
Production-Based Maintenance Triggers
For assets where condition correlates with production cycles — units produced, press strokes, kiln hours — maintenance is triggered by actual throughput rather than calendar time. A press die scheduled for service every 50,000 strokes receives its work order at exactly the right production-based interval.
5
Downtime and OEE Tracking
Unplanned downtime events are logged against the asset with cause classification. OEE dashboards show availability, performance, and quality rates per production line — linking maintenance performance directly to production output metrics for management reporting.
6
ROI Tracking and CapEx Forecasting
Maintenance cost per asset, reactive-to-planned ratio, and MTBF trend are tracked continuously. CapEx forecasting uses condition score trends to project major overhaul or replacement requirements 3–5 years out — so capital budget conversations are grounded in asset data, not guesses.
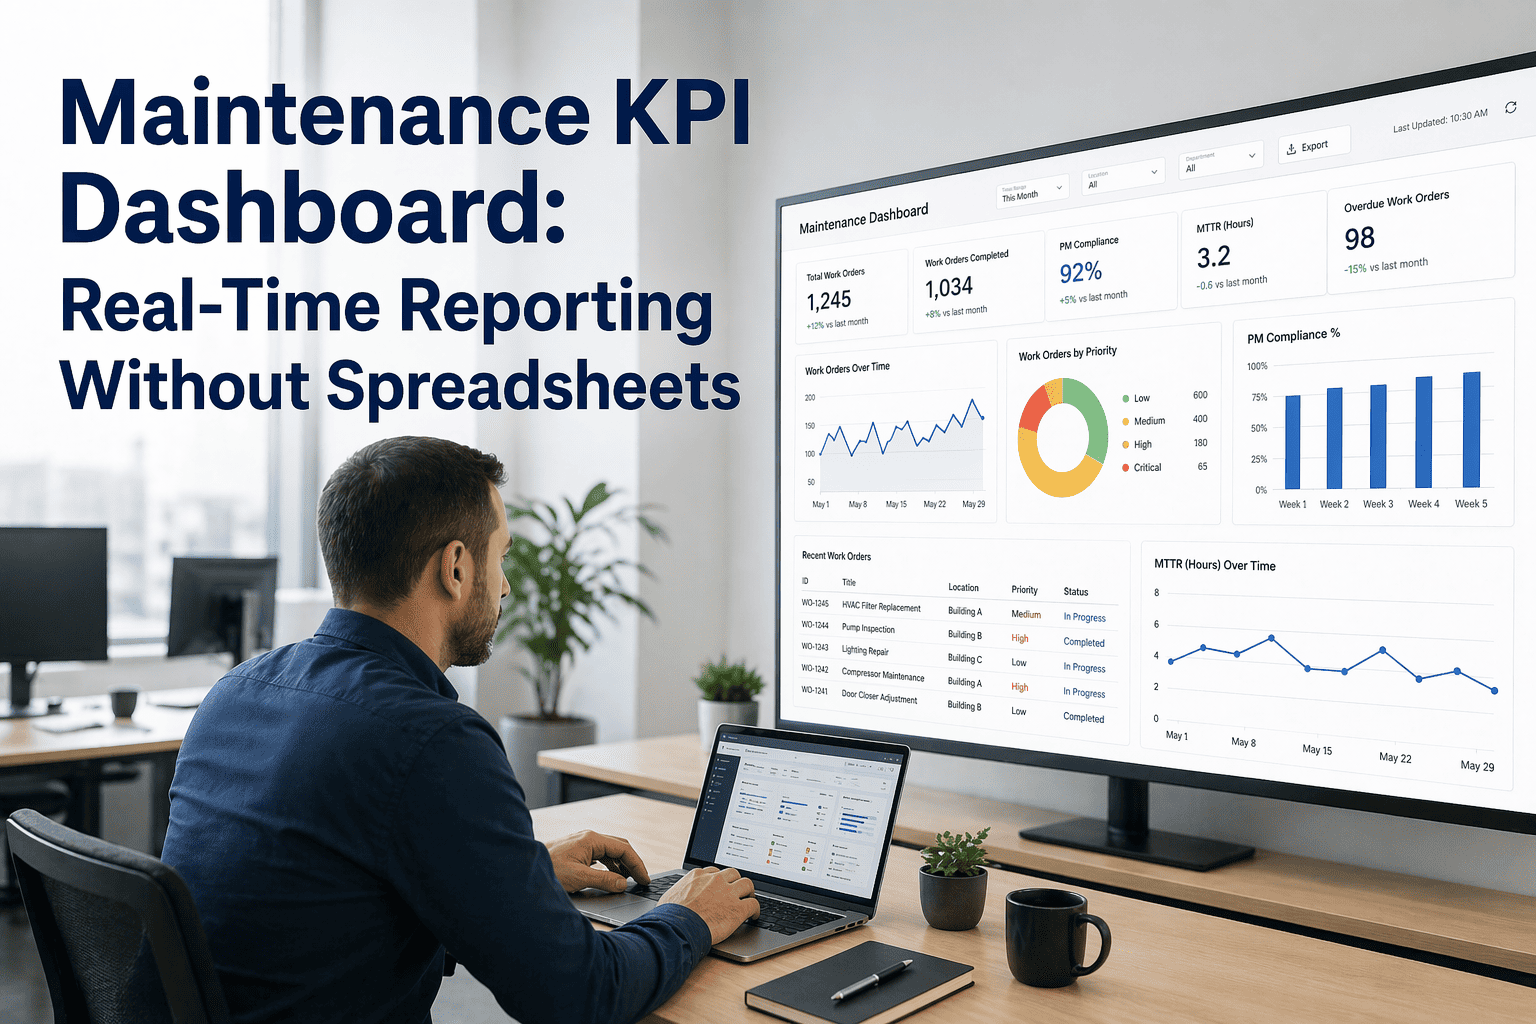
Predictive Maintenance ROI: What the Numbers Show
38%
Average maintenance cost reduction
Total maintenance spend reduction within 18 months of deploying structured predictive programs across 50+ asset portfolios
$260K
Annual downtime cost avoided
Average unplanned downtime cost reduction for a 80-asset manufacturing facility transitioning from 70% reactive to 70% planned maintenance
10:1
Return on PdM investment
Industry benchmark for return on predictive maintenance infrastructure investment — sensors, CMMS, and program management — measured over 3 years
92%
PM compliance rate with CMMS
Versus 54% compliance rate for the same facilities using paper-based or spreadsheet PM tracking — the execution gap that drives ROI difference
Frequently Asked Questions
How do you calculate the ROI of switching to predictive maintenance in manufacturing?
The ROI calculation has three components. First, avoided reactive repair cost — multiply your current annual emergency repair spend by 0.65 (the average reduction from PdM programs) to estimate avoidable cost. Second, avoided downtime cost — multiply your fully-loaded production hour rate by the hours of unplanned downtime in the last 12 months, then apply a 40–60% reduction factor for what PdM typically prevents. Third, subtract the annual cost of PdM infrastructure: sensors, CMMS licence, and additional inspection labour. Most manufacturing facilities reach positive ROI within 8–14 months of full PdM deployment.
Book a demo and we can walk through this calculation for your specific asset portfolio.
Which assets should a manufacturing facility prioritise for predictive maintenance first?
Priority is determined by three variables: criticality (assets whose failure stops production versus assets with redundancy), current failure frequency (assets requiring the most reactive interventions), and failure cost (assets where reactive repair or downtime cost is highest). Motor-driven rotating equipment on single-point critical production lines typically tops the priority list — these assets are sensorable, their failure modes are understood, and their reactive failure cost is the most measurable. Compressors, production pumps, and critical drives follow. Start with the eight assets that generated the most reactive maintenance spend in the last 12 months — they are where predictive maintenance delivers the fastest payback.
Start a free trial to begin building your asset criticality registry in Oxmaint.
What is the difference between condition-based and predictive maintenance, and does it matter in practice?
Condition-based maintenance (CBM) triggers work when a measured parameter crosses a threshold — vibration exceeds 10 mm/s, temperature rises 15°C above baseline. Predictive maintenance (PdM) goes further by modelling the trend to estimate when failure will occur, allowing intervention to be timed optimally rather than reactively to the threshold breach. In practice, most manufacturing operations benefit from CBM as the initial implementation — it is simpler to configure and delivers 70–80% of the ROI of full predictive modelling. PdM with ML adds value at higher asset criticality levels where optimising intervention timing delivers additional production availability gains. Both require the same foundational infrastructure: sensors, asset data, and a CMMS to execute the resulting work orders.
How does Oxmaint support manufacturing facilities transitioning from reactive to predictive maintenance?
Oxmaint provides the CMMS layer that makes predictive maintenance operational — not just detectable. Asset registry with criticality classification, IoT sensor integration for real-time condition data, condition-based and production-based PM triggers, work order management with full maintenance history, and OEE dashboards showing the relationship between maintenance performance and production output. Facilities typically start by registering their critical asset registry and shifting PM scheduling from calendar to condition-based triggers — this alone typically delivers 20–25% reduction in maintenance spend within 12 months before any additional sensor investment is required.
Book a demo to see how the transition works for your asset portfolio.
Every Hour Your Most Critical Assets Run Reactively Is Costing You 4.8x What Prevention Would Have Cost
Oxmaint gives manufacturing maintenance teams the asset registry, condition-based PM triggers, IoT integration, and downtime tracking to shift from reactive to predictive operations — without a six-month implementation project or a seven-figure technology investment.