A mid-size food manufacturer spent $412,000 in 2024 replacing a packaging line their finance team swore had three years left on paper. The depreciation schedule said the asset was still worth $180K. The maintenance log told a different story: $97K in repairs over 18 months, 340 hours of unplanned downtime, and an efficiency drop from 87% to 61%. Nobody had ever put those numbers next to the sticker price to see the total cost of ownership — until a consultant pulled them together and demonstrated the plant had been subsidising a failure for two years. This is the exact decision TCO analysis is designed to solve. Start a free trial of OxMaint to build a live TCO view of every major asset you own, or book a demo to see how operators make data-backed repair-vs-replace decisions in under 10 minutes.
Asset Management · TCO · Repair vs Replace
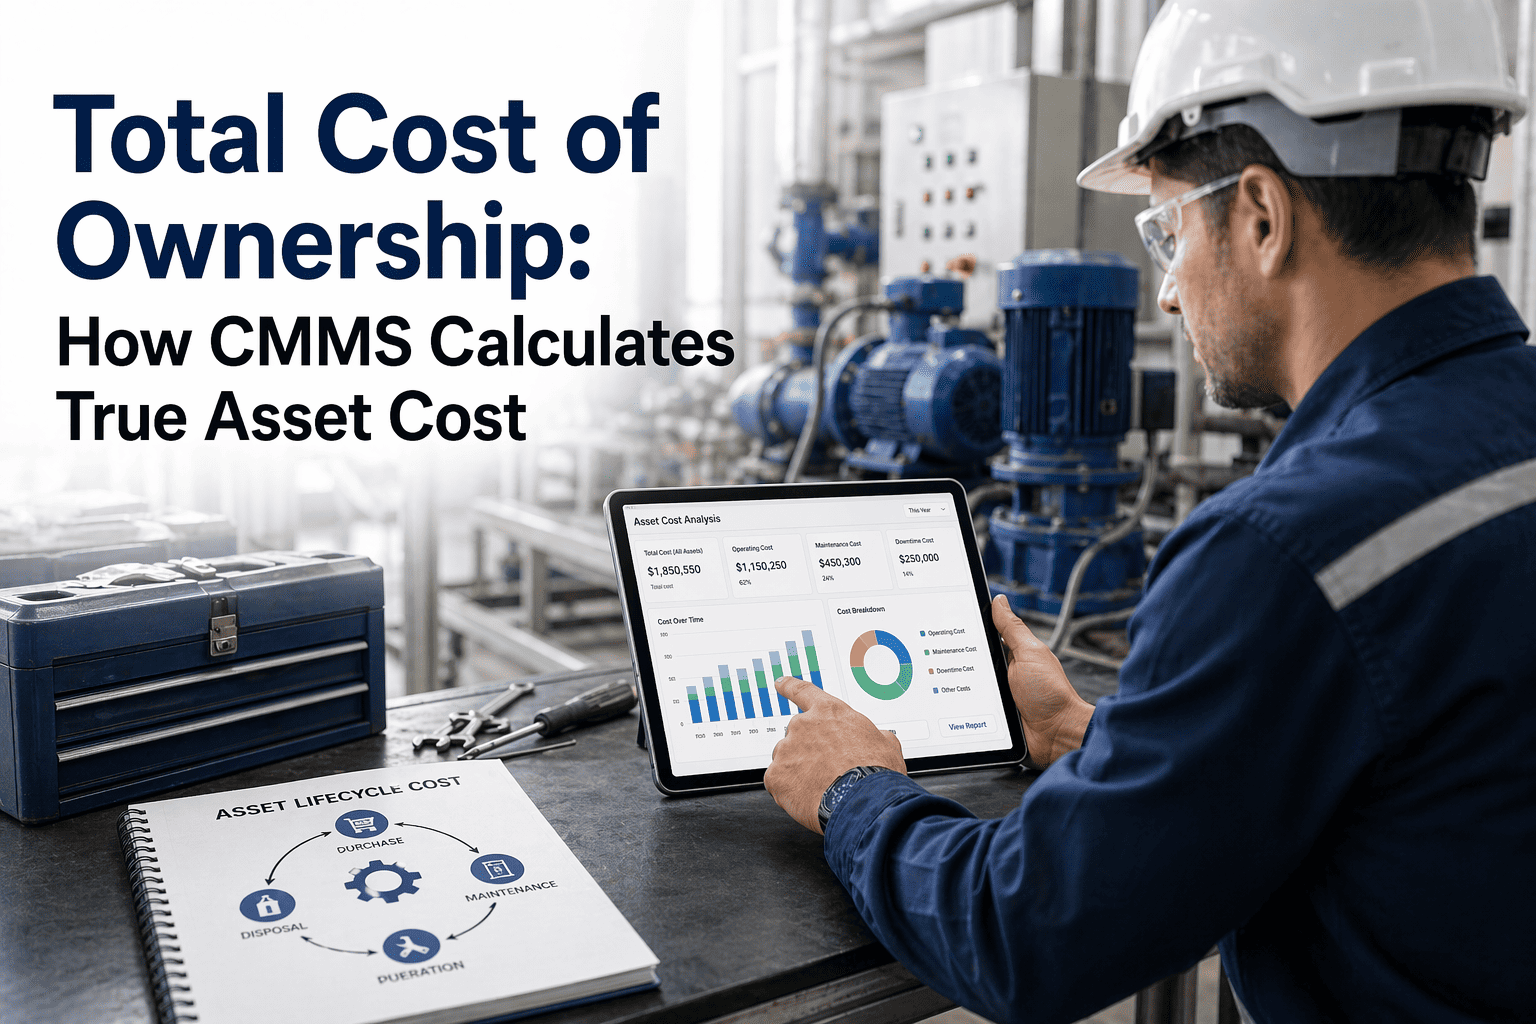
Total Cost of Ownership in CMMS: The Hidden 70–80% Finance Cannot See Without You
Purchase price is only 20–30% of what an asset actually costs over its lifecycle. OxMaint surfaces the other 70–80% — maintenance, energy, downtime, parts, labour, disposal — in one live TCO view that lets operations and finance make repair-vs-replace decisions together, on the same numbers, in real time.
20–30%
Share of true asset lifecycle cost represented by purchase price alone
75%
Industry-standard repair-vs-replace threshold used by asset managers
30–50%
Reduction in unplanned downtime from predictive maintenance strategies
3–5x
Energy cost over 10 years vs purchase price for continuously-run motors
Still making repair-vs-replace calls from a finance depreciation schedule?
That sheet sees book value. It does not see downtime, energy waste, or rising parts cost. Put real data on the table before the next CapEx cycle.
What Total Cost of Ownership Actually Captures
Total cost of ownership is the sum of every cost associated with an asset from acquisition through disposal. Purchase price is one line in that sum. The rest — installation, commissioning, training, energy, routine PM, corrective repairs, spare parts, downtime, compliance, decommissioning — typically adds up to 3–5 times the initial sticker price over a standard 10-year lifecycle. TCO is the single framework that prevents two of the most expensive mistakes in asset management: buying cheap gear that costs a fortune to run, and patching old gear that has quietly passed the replace threshold. Want to see how operators build a TCO view across a plant? Book a demo and walk through a live example.
The Cost Iceberg: What Most Finance Teams Actually See
Visible (20–30%)
Purchase Price20–30%
Installation & Commissioning3–6%
WATERLINE · What most CapEx decisions see
Hidden (70–80%)
Energy Consumption25–40%
Preventive & Corrective Maintenance12–20%
Spare Parts & MRO Inventory6–10%
Unplanned Downtime Losses8–18%
Operator & Technician Labour4–8%
Compliance, Training, Disposal2–5%
Why Purchase-Price Decisions Cost More Every Time
3–5x
Energy eats the motor decision
A 10% efficiency difference between two motors compounds over 8,000 annual operating hours into six-figure delta over a decade.
4.8x
Emergency repair premium
Reactive work costs roughly 4.8 times planned maintenance on the same failure — the economic core of TCO analysis.
30–50%
Legacy label cost gap
Poor documentation forces 30–50% more labour hours per repair — pure inefficiency waste hidden in the TCO.
$260K
Average unscheduled event
A single downtime event typically costs retailers $260K per incident. Across industrial, the number rises further.
The 75% Rule: The Repair-vs-Replace Decision, Visualised
The industry rule of thumb: if cumulative annual repair cost exceeds 75% of the replacement cost of the same asset, replacement is almost always the cheaper path once lifecycle costs are modelled. OxMaint maintains a running ratio automatically for every asset in the registry. Start a free trial to flag your at-threshold assets today.
Cumulative Repair Cost / Replacement Cost0%────────────────50%────────────────75%──100%
HVAC RTU — Unit 14
KEEP & Maintain
Packaging Line B
MONITOR Closely
Chiller — Plant 2
APPROACH Threshold
Compressor Skid 04
REPLACE Now
How OxMaint Builds a Live TCO View for Every Asset
01
Asset Registry with Financials
Every asset carries purchase price, install date, warranty, replacement value, and condition score in a single record — the foundation of every TCO calculation.
02
Work Order Cost Capture
Technicians log labour hours and parts issued per WO on mobile. Cumulative corrective + preventive spend updates live against each asset.
03
Downtime Event Valuation
Every downtime event carries a configurable cost-per-hour. OxMaint rolls that into TCO automatically — no spreadsheet reconciliation.
04
Energy & Utility Tracking
Meter readings, IoT sensor data, or SCADA streams feed per-asset energy consumption into the TCO model as a primary cost line.
05
Remaining Useful Life Engine
Design life minus age minus condition adjustment gives a dynamic RUL that updates as maintenance history accumulates. Drives replacement timing.
06
Repair-vs-Replace Threshold Alerts
Automatic alerts when an asset crosses 50%, 75%, or 100% of replacement cost in cumulative repairs. Finance and operations see the same number.
Spreadsheet TCO vs OxMaint TCO: What Changes
| TCO Input | Typical Spreadsheet Approach | OxMaint Live Approach | Consequence of the Gap |
|---|
| Purchase price | One-time entry, often stale | Linked to asset record, version-controlled | Clean baseline |
| Maintenance costs | Quarterly summary, aggregated | Per-asset, per-WO, updated live | True picture |
| Downtime cost | Usually omitted entirely | Event-based, cost-per-hour applied | Biggest hidden line exposed |
| Energy usage | Plant-level only, no asset split | Meter/IoT data by asset | Motor/compressor lifecycle clarity |
| Repair-vs-replace signal | Triggered after failure | Predictive, threshold alerts | Decision weeks earlier |
| CapEx justification | Gut feel or vendor quote | Condition data + RUL + cost trend | Finance-committee ready |
The ROI of TCO Discipline in a Single Year
40–65%
CapEx budget variance without asset data
Compared to under 15% with data-driven TCO
10–25%
Maintenance spend reduction
From predictive strategies layered on TCO data
35–50%
Surprise capital events avoided
Structured CapEx forecasting benchmark
3–4x
CMMS ROI within 18 months
Via PM compliance + downtime reduction
Practical TCO Mistakes Operators Make — and How to Avoid Them
Mistake 01
Running TCO on 2–3 years only
Short horizons systematically favour cheap unreliable assets. Match the analysis period to service life or contract term, whichever is longer.
Mistake 02
Omitting downtime from the model
The single biggest hidden TCO line. Every downtime hour must be converted to revenue or production cost and loaded into the model.
Mistake 03
Under-modelling energy
For motors and compressors run 24/7, energy routinely exceeds purchase price by 3–5x over a decade. Verified efficiency data is non-negotiable.
Mistake 04
Zeroing out disposal costs
Decommissioning, environmental remediation, and specialised labour can rival 5–10% of purchase price. Net-of-scrap is rarely accurate.
Frequently Asked Questions
How is TCO different from lifecycle cost (LCC)?
Lifecycle cost is the engineering analysis technique — a model of all costs from design through disposal. TCO is the broader business framework that also captures softer items: productivity losses, integration overhead, vendor support quality. In practice, both frameworks aim at the same outcome: move decisions beyond purchase price. OxMaint supports both without duplicate data entry.
Book a demo to see the reports.
What data do we need to start building TCO views in OxMaint?
The essentials: asset purchase price, install date, replacement cost estimate, design life, and the last 6–12 months of work order data. Most plants have this in scattered form already. OxMaint's asset registry consolidates it in one pass, and TCO calculations populate automatically from that baseline.
Start a free trial and upload your asset list to begin.
How often should repair-vs-replace thresholds be reviewed?
Monthly for critical production assets, quarterly for support systems. OxMaint's alert engine surfaces threshold crossings in real time so the discussion happens when the data warrants — not on a calendar. Finance and operations can share a single live view during the CapEx cycle, eliminating the classic reconciliation loop.
Can OxMaint export TCO reports to our ERP or finance system?
Yes. OxMaint exports asset-level TCO, RUL, and repair-ratio data in formats that feed directly into SAP, Oracle, NetSuite, Microsoft Dynamics, and most mid-market ERPs via API. Finance teams work from the same source of truth as operations without maintaining parallel spreadsheets.
Stop Paying 70% of the Cost You Cannot See
OxMaint turns every maintenance event, downtime hour, energy reading, and part transaction into a live lifecycle cost view — giving operations and finance the shared picture they need to keep the right assets and replace the wrong ones, on time.