A plant manager at a beverage facility was asked by her VP of Operations to explain why maintenance costs had jumped 18% year-over-year while equipment reliability had dropped. She did not have an answer — not because the data didn't exist, but because it lived in four disconnected systems. The CMMS had work orders. The ERP held cost data. SCADA logged runtime. A spreadsheet tracked PM compliance, updated monthly when someone remembered. The early-warning signs had been visible for six months; nobody had a dashboard that could see them. This is the problem a real-time maintenance KPI dashboard solves. Start a free trial of OxMaint to see every critical metric update live from your work orders, or book a demo to walk through dashboards configured for your exact asset base.
Analytics · Real-Time Reporting · CMMS
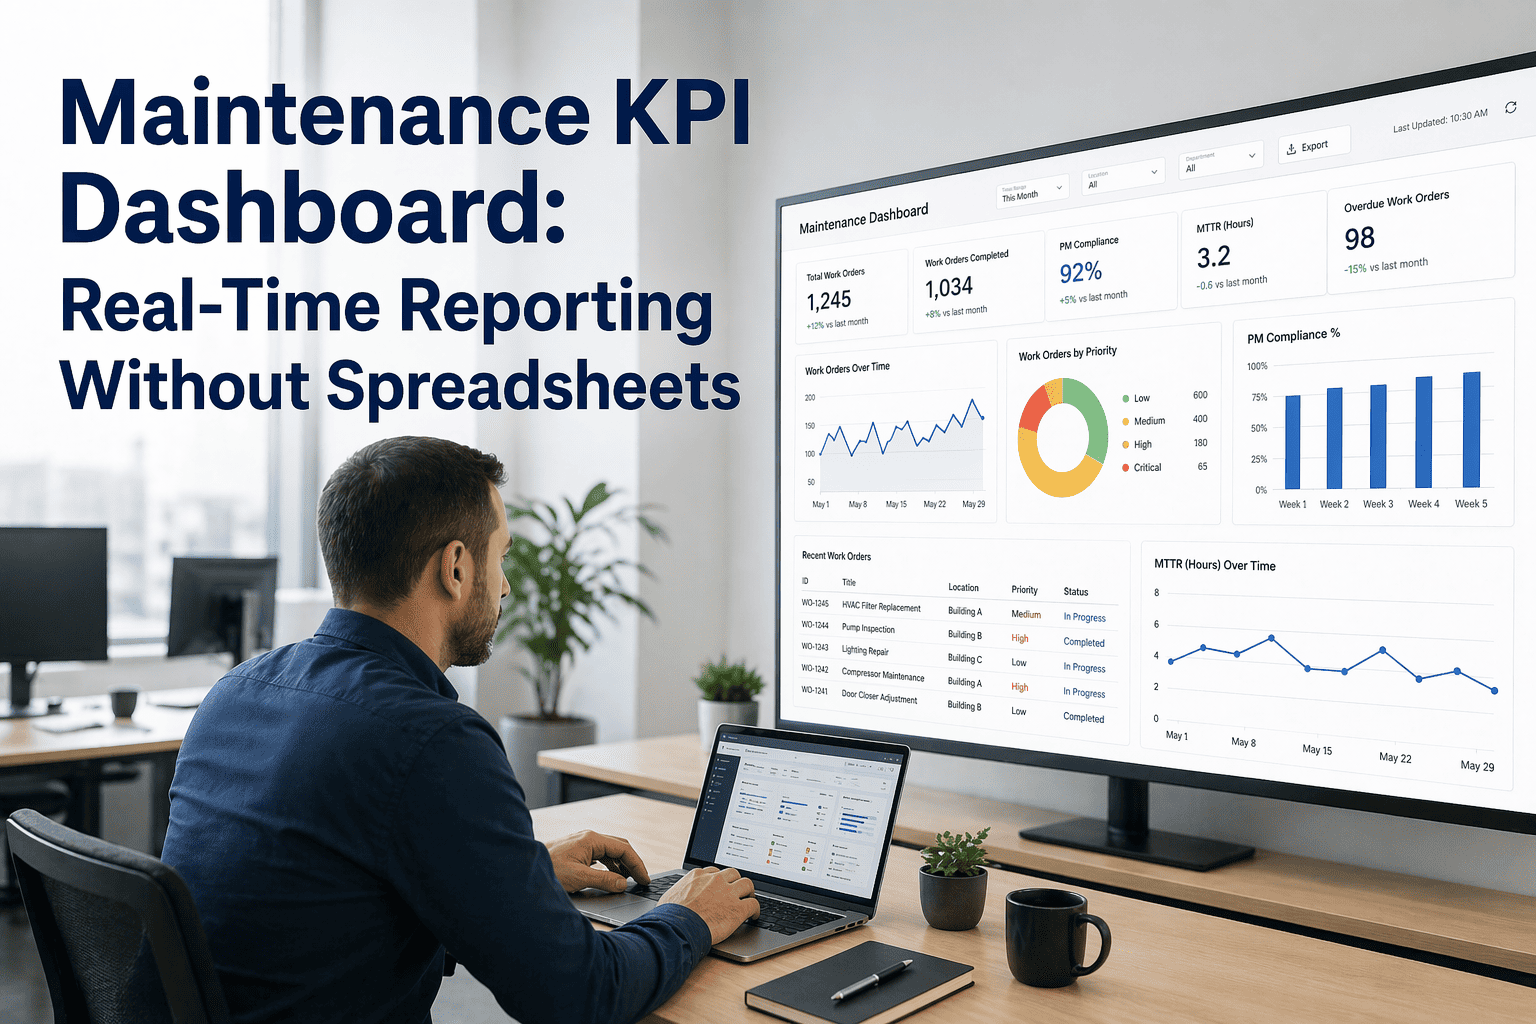
Maintenance KPI Dashboard with Real-Time Metrics: MTTR, PM Compliance, and the Numbers That Actually Matter
OxMaint's KPI dashboard calculates MTTR, MTBF, PM compliance, wrench time, and OEE automatically from every work order your technicians close — updated live, on every device, for every role from technician to VP of operations. No spreadsheets. No end-of-month scramble. No lagging reports from six weeks ago.
56%
of facilities track PM compliance as their top maintenance KPI (Plant Engineering 2025)
90%+
world-class benchmark for PM compliance per SMRP Best Practices 6th Edition
25%
uptime advantage reported by operators using standardised KPIs (McKinsey 2024)
75%
reduction in KPI reporting time achieved by large-scale CMMS deployments
Still compiling maintenance metrics in a spreadsheet every Friday?
You are managing last month's problems. A live dashboard lets you catch this week's before they escalate. See yours configured in 15 minutes.
What a Real-Time Maintenance KPI Dashboard Actually Is
A real-time maintenance KPI dashboard is not a weekly report in prettier clothing. It is a live, self-calculating view of the metrics that indicate whether your maintenance programme is performing — or failing — right now. Every time a technician closes a work order on mobile, every time a PM is completed late, every time a failure is logged against an asset, the dashboard updates automatically. This closes the gap between signal and response from weeks to minutes. The difference shows up in reactive maintenance rates, emergency spend, and production availability within the first full quarter of use. Book a demo to see live KPI data from a working plant.
The Big 6 KPIs Every Live Dashboard Must Display
MTTR
Mean Time To Repair
Industry target: under 6 hours planned · under 8 hours unplanned
Measures maintenance execution speed. Rising MTTR almost always points to parts unavailability, skill gaps, or diagnostic delays — not technician laziness.
MTBF
Mean Time Between Failures
Track trend not absolute · rising = PM programme working
The reliability metric. MTBF is the lagging indicator that confirms whether your PM programme and asset discipline are actually increasing uptime.
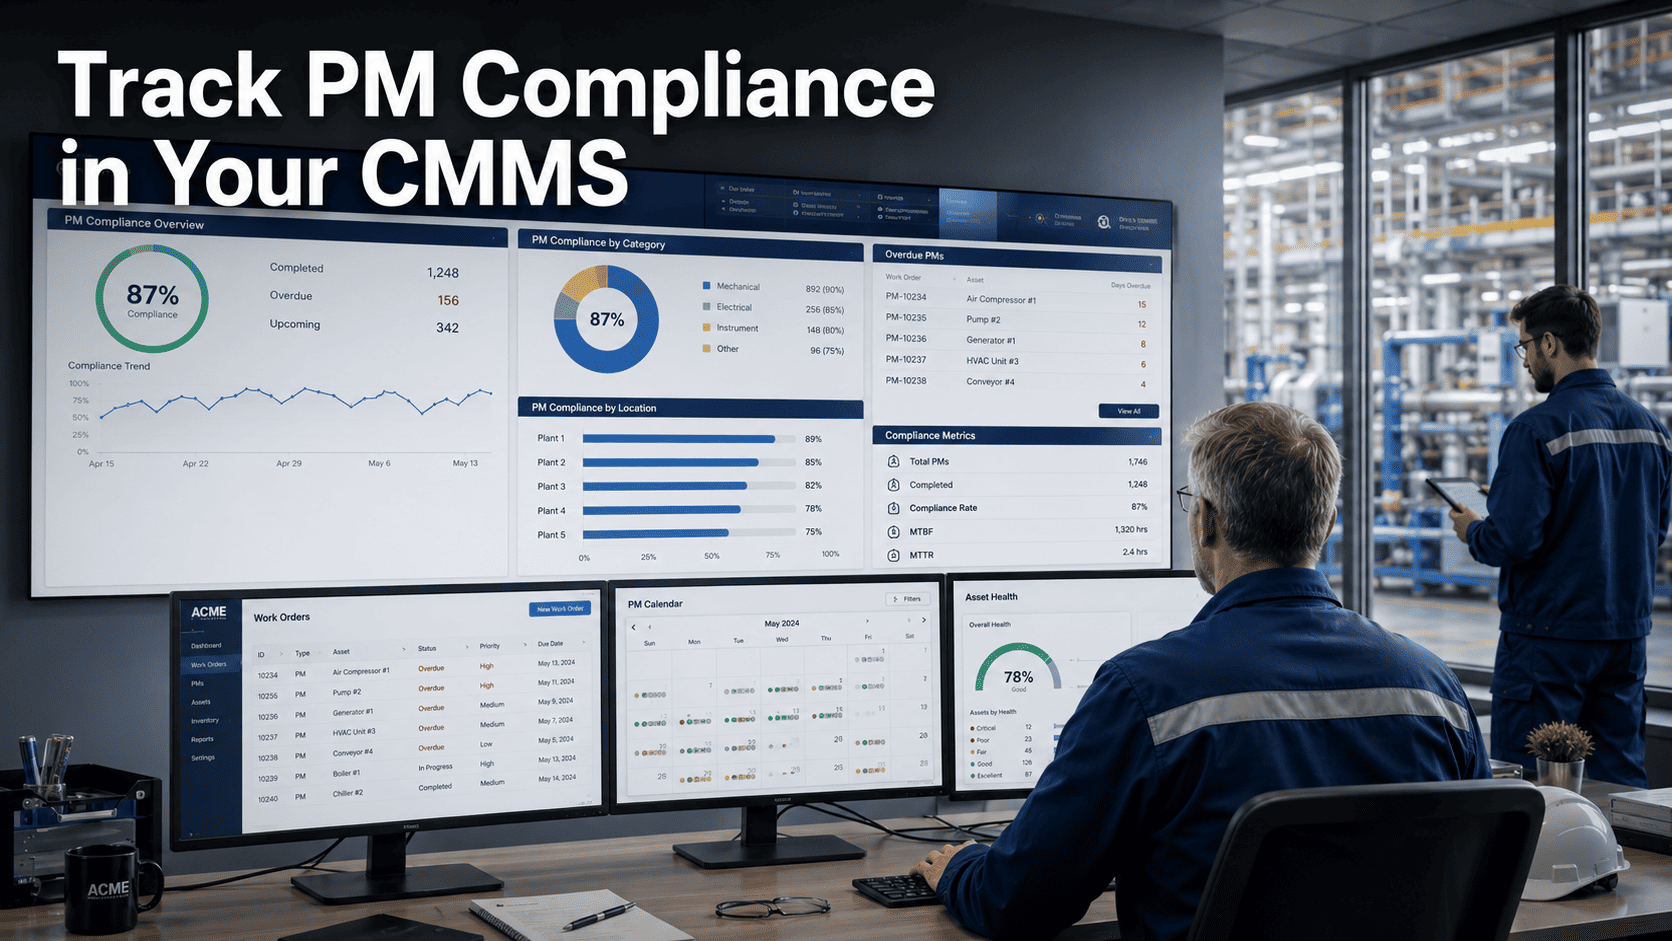
PM %
PM Compliance Rate
World-class: 90%+ · Below 80% = programme failing
The single most predictive leading indicator. Scheduled PMs completed on time vs total scheduled. Falling compliance always precedes rising breakdowns.
PMP
Planned Maintenance Percentage
Target: above 70% planned · world-class: above 80%
Ratio of planned hours to total maintenance hours. Below 50% planned means you are fighting fires, not running a programme.
OEE
Overall Equipment Effectiveness
World-class: 85%+ · Most plants: 60–70%
Combines availability, performance, and quality. The metric that translates maintenance work directly into production-floor output and P&L.
WT
Wrench Time
Typical: 25–35% · Improved: 50–55%
Hands-on maintenance time as a share of shift. Every percentage point recovered = added capacity without additional headcount.
Leading vs Lagging Indicators: Why the Split Matters
Most dashboards fail because they show only lagging indicators — numbers that describe what already happened. Strong dashboards combine both. Leading indicators tell you whether the programme is set up to succeed tomorrow. Lagging ones tell you whether it actually did yesterday. Start a free trial and see both live side-by-side.
Leading Indicators · Predict the Future
LPM Compliance Rate — scheduled work completed on time. Falls first when the programme is under strain.
LSchedule Compliance — planned work executed in the planned week. Catches resource imbalance early.
LBacklog (in weeks) — pending work expressed as crew-weeks. Rising backlog predicts reactive spike.
LPlanned Maintenance % — proactive share of total work. Controls the reactive bleed before it happens.
Lagging Indicators · Confirm the Past
GMTBF — confirms whether reliability is actually improving across each asset class.
GMTTR — confirms execution speed and exposes parts, skill, or routing bottlenecks.
GEmergency WO Rate — confirms how much of your spend is reactive vs controlled.
GOEE & Availability — confirms whether maintenance performance is landing in production output.
Inside OxMaint: What a Live Maintenance Dashboard Shows You
Plant Ops Dashboard · Line B · Live
Updated 12 sec ago
93%
PM Compliance
Target 90% · +4 pts MoM
4.2h
MTTR
Target 6h · -0.8h MoM
68%
PMP
Target 70% · Watch
33%
Wrench Time
Industry avg
PM Compliance · Last 12 Weeks
78
81
79
83
85
87
86
88
90
91
92
93
How OxMaint Generates Every KPI Automatically
Source 01
Mobile Work Order Closure
Technicians log start time, completion time, work type (PM vs reactive), and labour hours as they close tickets on mobile. Drives MTTR, PMP, and wrench time live.
Source 02
Asset Failure History
Every work order links to a specific asset. Failure timestamps roll up into MTBF automatically — by equipment, class, or plant section.
Source 03
PM Schedule Engine
Calendar, meter, or condition-triggered PMs auto-generate. Completed vs scheduled feeds PM compliance in real time.
Source 04
IoT & SCADA Feed
Runtime, downtime events, and sensor data stream directly into OxMaint. Availability and OEE calculated from live equipment state.
Source 05
Parts & Inventory Transactions
Parts issued per work order drive cost-per-asset and cost-per-hour metrics. Stockout events flagged against MTTR impact.
Source 06
Role-Based Live Views
Technicians see work queues. Supervisors see team productivity. Managers see plant KPIs. VPs see portfolio trends. One data core.
Before OxMaint vs After: The Dashboard Shift
| Capability | Spreadsheet-Based Reporting | OxMaint Live Dashboard | Impact |
|---|
| Data freshness | Weekly or monthly, manually compiled | Live, sub-minute refresh | ~6 weeks faster signal |
| Calculation effort | 8–20 hours/month per plant | Zero manual effort | Analyst hours freed |
| Data integrity | Copy-paste errors common | Single source of truth | Audit-grade reliability |
| Drill-down | Static totals only | Plant → line → asset → WO | Root cause in seconds |
| Mobile access | Email attachments | Native mobile app | Dashboards in the field |
| Leading indicator coverage | Often missing entirely | PM compliance, backlog, schedule | Predict, don't react |
Measurable Dashboard Outcomes in the First 12 Months
89%
Report-generation time reduction
From days of compilation to instant exports
81%
PM compliance uplift
Visibility + accountability in one change
57%
Reactive ratio reduction
Leading indicators caught before escalation
44%
MTTR reduction across asset classes
Parts staging & routing optimised
Review Cadence: When to Act on Each Metric
Daily
Active work queue, critical alerts, today's PMs due, open emergency WOs
Supervisors, technicians
Weekly
PM compliance, schedule adherence, backlog in weeks, WO aging
Maintenance managers
Monthly
MTBF trend, MTTR trend, planned/reactive ratio, cost per asset
Plant managers
Quarterly
OEE, CMARV, cost per operating hour, benchmark comparisons
Directors, VPs
Frequently Asked Questions
How long does it take to see useful KPI data in OxMaint?
PM compliance and schedule compliance populate within the first week of PM scheduling. MTTR and wrench time calculate from the first work orders technicians close on mobile — so within days. MTBF and reliability trends need 60–90 days of consistent work-order data to become statistically meaningful.
Start a free trial to start the clock today.
Can different roles see different views of the same KPI data?
Yes. OxMaint serves role-based dashboards from the same underlying data. A technician sees their work queue and today's PMs. A supervisor sees team productivity and backlog. A plant manager sees plant-wide reliability. A VP sees portfolio KPIs across sites. No duplicate data. No separate reporting systems.
Do we need IoT sensors for OEE and availability dashboards?
Not required but recommended. OxMaint calculates availability, MTBF, and MTTR from work-order downtime data alone. For true OEE with performance and quality factors, integration with SCADA, PLC, or IoT data feeds is typical. Both paths are supported.
Book a demo to see the options for your plant.
How do we avoid dashboard overload and track only what matters?
Start with the Big 3: PM compliance, MTTR, and planned-to-reactive ratio. These three alone drive most operational improvement. Add MTBF, OEE, and cost-per-operating-hour after 90 days once your work-order data is clean. OxMaint lets you hide or pin KPIs per role so nobody drowns in irrelevant numbers.
Stop Reporting Yesterday's Numbers. Start Managing Today's.
OxMaint turns every work order closure into a live KPI update — for every role, every device, every plant. Replace monthly spreadsheets with minute-by-minute operational truth, and catch the problems worth catching before they hit production.