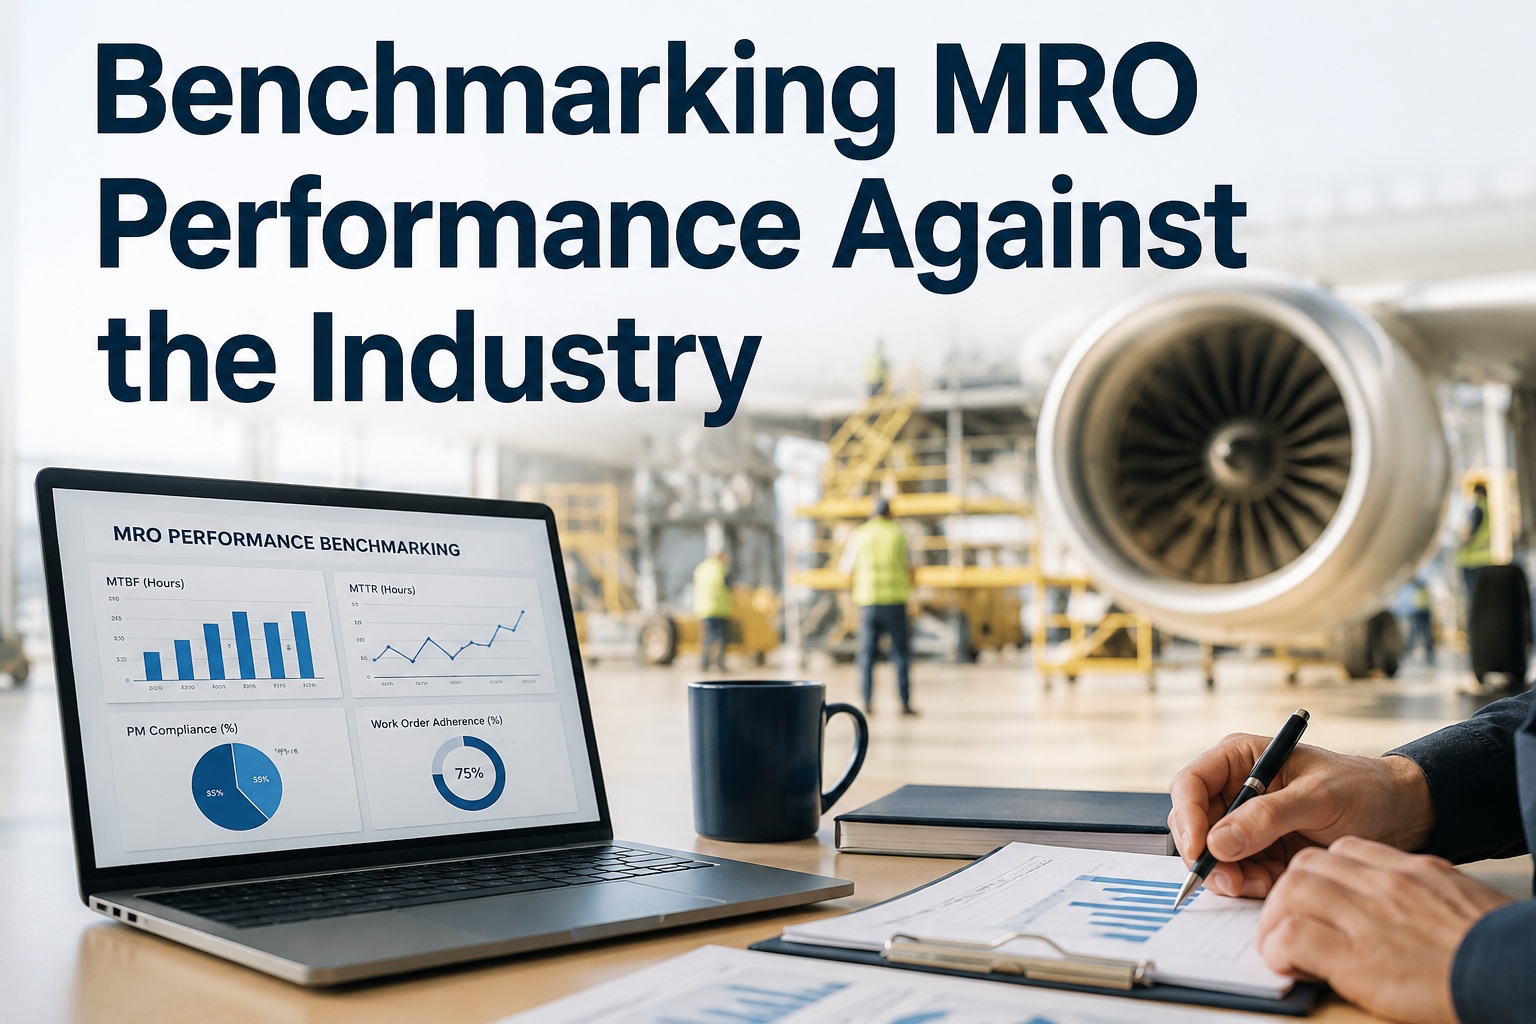
MRO benchmarking is the practice of comparing your maintenance, repair and overhaul performance against industry standards so you can see whether your operation is genuinely competitive or just busy. Internal metrics like turnaround time, cost per flight hour and quality escapes only mean something when stacked against aviation MRO benchmark ranges — and the gaps between your numbers and best-in-class MRO performance are where your most profitable improvement projects hide. This guide breaks down the core MRO benchmark metrics, realistic industry ranges, and a practical process for turning an MRO performance comparison into a credible improvement plan. If you want to start measuring against industry benchmarks with real data instead of spreadsheets, Start Free Trial and see your own numbers in days.
Is your MRO operation actually competitive — or just keeping up with itself?
Most MRO managers track dozens of internal KPIs yet can't answer one simple question: how do we compare to the industry? Benchmarking MRO performance against aviation maintenance benchmark standards closes that gap — and tells you exactly which improvements will pay back fastest.
The 5 MRO benchmark metrics that actually define competitiveness
Across aviation MRO benchmark studies and industry surveys, five metrics consistently separate top-quartile performers from the rest. If you only benchmark five things, benchmark these.
The single most-watched MRO performance benchmark. Best-in-class component shops hold TAT within ±10% of quoted times; average shops routinely blow quotes by 30–50%. Track TAT by work scope, not as one blended average.
Maintenance cost per flight hour typically runs $1,000–$3,500 for narrowbody fleets depending on age and utilization. A 10% gap versus the aircraft MRO benchmark for your fleet type can mean millions annually across a mid-size operation.
Defects discovered after release — the metric that destroys trust. Best-in-class MRO operations keep escapes below 0.5 per 1,000 work orders; anything above 2 per 1,000 signals systemic process or training gaps.
Productive bay occupancy of 75–85% is the industry norm for healthy shops. Below 60% you're carrying idle capacity; above 90% you're one delay away from a scheduling cascade that wrecks every TAT promise.
Top performers run 80%+ planned maintenance. If more than 30–40% of your labor hours are reactive, you're paying the reactive premium — typically 2–3x the cost of the same work done on schedule.
Every best-in-class MRO benchmark number traces back to the same root: clean, real-time data. You can't compare what you can't measure — and spreadsheets can't measure this.
MRO industry benchmark table: where does your operation sit?
Use these aviation maintenance benchmark ranges as a starting MRO comparison against industry norms. Your exact target depends on fleet type, work scope and region — but the quartile spread is remarkably consistent.
| Benchmark Metric | Bottom Quartile | Industry Median | Best-in-Class |
|---|---|---|---|
| TAT adherence (on-time release) | < 70% | 80–85% | > 95% |
| Quality escapes per 1,000 work orders | > 2.0 | 0.8–1.5 | < 0.5 |
| Planned maintenance share | < 55% | 65–75% | > 80% |
| Bay / hangar utilization | < 60% | 75–85% | 85–90% (stable) |
| Wrench time (direct labor efficiency) | < 45% | 55–65% | > 70% |
| Inventory fill rate (parts on demand) | < 85% | 90–94% | > 97% |
Sources: composite of published aviation MRO benchmark surveys, OEM service data and industry association reports. Use ranges directionally — the trend over time matters more than any single snapshot.
What a 12-point TAT gap actually costs: a real scenario
Benchmarks only matter when you translate them into money. Here's a composite scenario based on a mid-size component MRO shop running an MRO performance comparison for the first time.
How to benchmark MRO performance in 4 steps (and actually act on it)
Most MRO benchmarking efforts die in a slide deck. This four-step loop keeps yours tied to decisions, dollars and deadlines.
Pull 12 months of actual TAT, cost per flight hour, escape rate and planned/unplanned ratio from your work-order history. If that history lives in spreadsheets and paper, this step alone justifies a CMMS — you need trustworthy data before any MRO industry comparison is valid.
A widebody heavy-check shop and a regional component shop have different aircraft maintenance benchmarking norms. Compare against operations with similar fleet mix, work scope and utilization — otherwise you'll chase the wrong targets and demoralize the team.
Apply the gap-value formula to each metric. A 5-point fill-rate gap often costs more than a scary-looking escape rate. Pick the top two gaps, assign owners, and set a 90-day target — benchmarking without a deadline is trivia.
MRO performance standards shift as the industry adopts predictive maintenance and digital tooling. Quarterly re-benchmarking turns a one-off project into a continuous-improvement engine — and gives you credible, data-backed targets for leadership and customers.
Benchmark your MRO operation with live data — not last quarter's spreadsheet
OxMaint is an AI-powered CMMS + EAM platform that captures every work order, labor hour, part and delay automatically — so your MRO benchmark metrics are always current, auditable and comparable against industry standards.
Live dashboards track turnaround time by work scope, bay and technician — shops using OxMaint typically cut TAT variance 20–30% in the first two quarters by spotting bottlenecks the day they form.
Shift your planned/unplanned ratio toward the 80%+ best-in-class MRO benchmark. Automated PM triggers and AI failure prediction cut unplanned downtime 30–50% and kill the reactive premium.
Stock-out alerts and demand forecasting push parts fill rates toward the 97% top-quartile mark — eliminating the parts-wait delays that quietly add 3–5 days to average TAT in most shops.
Every task sign-off, inspection and release is timestamped and traceable — driving escape rates below 0.5 per 1,000 work orders and keeping you audit-ready for FAA, EASA and ISO 55000-aligned reviews.
Book a 30-minute demo — we'll map your top 3 benchmark gaps live
Bring your current TAT, cost and quality numbers. Our team will show you exactly how OxMaint tracks them against MRO industry benchmarks and where your fastest payback sits.
MRO benchmarking: frequently asked questions
MRO benchmarking is the process of comparing your maintenance, repair and overhaul metrics — turnaround time, cost per flight hour, quality escapes, utilization — against industry standards and best-in-class performers. It converts internal KPIs into competitive context, revealing which gaps cost you the most and which improvement projects will pay back fastest.
Best-in-class MRO operations hold actual TAT within ±10% of quoted times and achieve 95%+ on-time release. The industry median sits at 80–85% adherence, and bottom-quartile shops fall below 70%. Because norms vary by work scope, benchmark TAT by job type rather than as one blended average.
Start with five: TAT adherence, cost per flight hour, quality escape rate, hangar/bay utilization, and planned-vs-unplanned work ratio. Together they cover speed, cost, quality and capacity. A CMMS like OxMaint captures all five automatically from your work orders — Start Free Trial to see your baseline within weeks.
Quarterly is the practical standard. Annual benchmarking is too slow to steer improvement projects, while monthly creates noise from normal volume swings. Quarterly re-benchmarking lets you verify that gap-closure projects are working and keeps your targets aligned with evolving MRO performance standards across the industry.
You can't — at least not credibly. Spreadsheet-based records miss labor hours, delays and rework, so your baseline is fiction. The first step is digitizing work orders in a CMMS; most teams have 90 days of clean, benchmarkable data within one quarter. Book a Demo and we'll show you how OxMaint builds that baseline from day one.
Turn your MRO data into a benchmark-backed improvement plan
OxMaint captures every metric this guide covers — automatically, in real time. See where you stand against the industry and which gaps are worth the most to close.