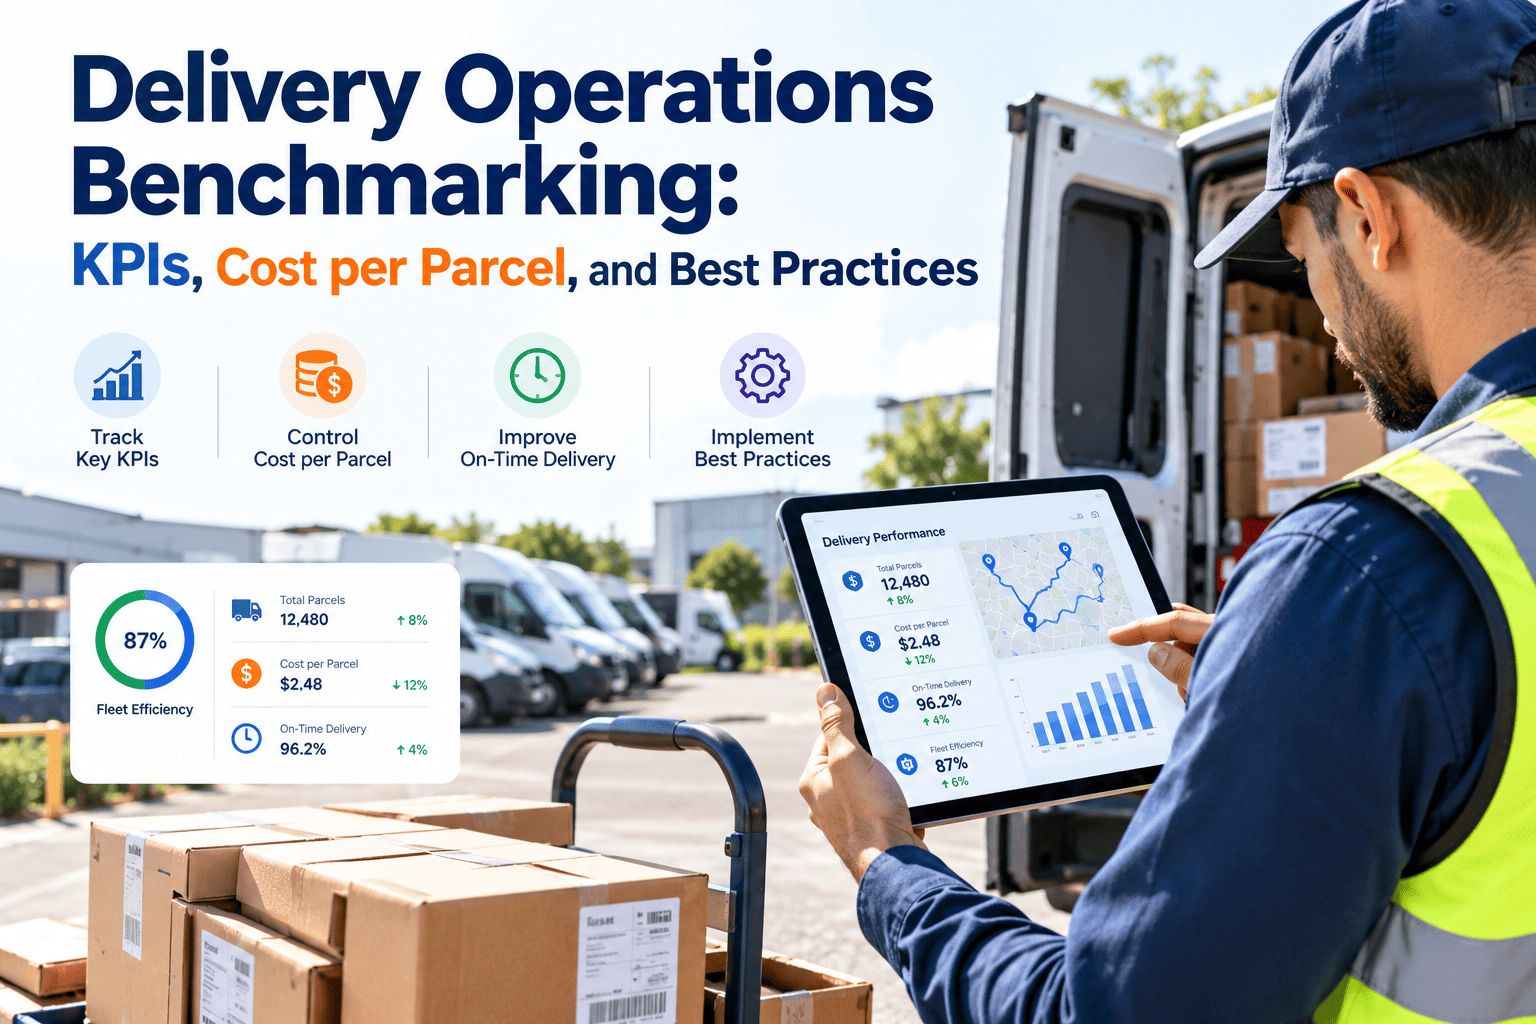
Every delivery operation has numbers it considers normal: an on-time rate, a cost per parcel, a stops-per-hour figure the team has quoted for years. Benchmarking is how you find out whether those numbers are strong, average or quietly weak compared with similar operations. Done well, it sets realistic targets, exposes where to invest and gives leaders evidence for budget requests. Done badly, it produces a decorative slide of mismatched comparisons. This guide covers which KPIs to benchmark, where data comes from, how to compare like with like, and how to turn gaps into action. Maintenance and fleet availability belong in the picture too, and you can see how Oxmaint reports them.
Delivery Operations Benchmarking: KPIs, Cost per Parcel, and Best Practices
Compare your performance with credible peers, normalize the differences, and convert every gap into a funded, owned improvement.
What benchmarking is for, and what it is not
Good uses
- Setting targets grounded in what comparable operations achieve.
- Finding which metrics lag most, so effort goes where it matters.
- Justifying investment in routing, fleet or automation with outside evidence.
- Testing whether an internal result is a one-off or a structural gap.
Poor uses
- Copying a headline number from a vendor brochure without context.
- Comparing a dense urban network with a rural one.
- Chasing the top performer on every metric at once.
- Using one number to judge a team without understanding its constraints.
A benchmark is a question, not an answer. It tells you where to look, and your own data tells you why.
KPI families worth benchmarking
| Family | Core KPIs | What it reveals | Normalize by |
|---|---|---|---|
| Service quality | On-time rate, first-attempt success, damage and loss rate, contact rate per parcel | Whether customers get what was promised | Service level, delivery window length, parcel type |
| Cost | Cost per parcel, cost per stop, cost per route, fuel and labor share | How efficiently resources convert into deliveries | Density, region, parcel size and weight, service mix |
| Productivity | Stops per hour, parcels per route, drops per stop, route utilization | Planning and execution quality | Stop density, building type, delivery proof requirements |
| Fleet and assets | Vehicle availability, PM compliance, unplanned downtime, maintenance cost per vehicle | Whether capacity is real or only on paper | Vehicle age, duty cycle, fuel type |
| Depot and warehouse | Sort throughput, dwell time, dispatch on-time rate, equipment uptime | How well the hub feeds the road | Volume profile, automation level, shift pattern |
| People and safety | Injury rate, turnover, absence, overtime share | Sustainability of the operating model | Role mix, seasonality, tenure |
| Sustainability | Emissions per parcel, share of electric kilometers, failed-delivery miles | Environmental and regulatory exposure | Fuel mix, region, reporting boundary |
Cost per parcel: break it apart before comparing it
Illustrative layout only. The shares differ widely by network, so measure your own components.
Define the boundary
Decide whether the figure includes middle-mile, sortation, returns, customer service and vehicle ownership. Peers often use different boundaries.
Split fixed and variable
Vehicle leases and depot rent behave differently from fuel and overtime, so separate them to see what responds to volume.
Include maintenance explicitly
Repairs, downtime, spare vehicles and towing are often buried in vehicle cost. Show them separately so fleet decisions are visible.
Know your fleet numbers before you compare them
Oxmaint reports PM compliance, downtime, maintenance cost and work order backlog by asset, so fleet KPIs in your benchmark are measured the same way every month.
Where benchmark data comes from
Industry and trade sources
- Logistics and supply chain associations that publish survey results.
- Consulting and research firms with annual operations studies.
- Government transport statistics for fleet and fuel measures.
- Public sustainability reports from large carriers.
Peer and network sources
- Peer exchange groups where members share anonymized data.
- Carrier and 3PL performance data for comparable lanes.
- Software and telematics providers who benchmark across customers.
- Internal comparisons between depots with similar profiles.
Grade every source
Ask how many operations contributed, how metrics were defined, how recent the data is and who funded the study. A small sample of very large carriers will not reflect a regional fleet. Treat marketing statistics with caution unless the method is explained.
Making comparisons fair: the normalization checklist
Geography and density
Stops per square kilometer, urban versus suburban versus rural, and typical drive time between stops.
Service level
Same-day, next-day, scheduled windows, signature required, and whether the customer chooses a time.
Parcel profile
Weight, dimensions, fragility, temperature control and share of oversized items.
Fleet profile
Vehicle type, age, fuel or electric mix and daily duty cycle.
Workforce model
Employed, contracted or gig drivers, shift length, overtime rules and union agreements.
Seasonality
Compare the same period, since peak weeks distort averages in both directions.
Definitions
What counts as on time, a failed attempt, a stop or a parcel. Align terms before comparing numbers.
Cost boundary
What is in and out of the figure, such as facilities, technology, claims and customer service.
A benchmarking process that ends in action
Choose a short list of KPIs
Pick six to eight metrics tied to strategy, such as cost per parcel, on-time rate, first-attempt success and fleet availability.
Clean your own data first
Document definitions, fix gaps and agree who owns each measure. Weak internal data makes any comparison unreliable.
Select a peer set
Choose operations with similar density, service level and fleet, plus one or two stretch references with a different model.
Normalize and compare
Adjust for density, parcel mix and definitions, then express results as a range rather than a single number.
Diagnose the gaps
For each material gap, trace the driver: planning, execution, fleet, depot or customer behavior.
Assign actions and review
Give each initiative an owner, a target and a date, and repeat the benchmark on a regular cycle.
Turning gaps into priorities
Do first. Examples: fixing PM schedules on the vehicles that break most, standardizing failed-delivery codes, improving address validation.
Plan as projects. Examples: new routing software, depot layout changes, fleet electrification programs.
Fill gaps. Examples: tidying reports, adjusting dispatch cut-offs, minor checklist changes.
Avoid or defer. Examples: chasing a top-quartile figure in a metric that barely affects cost or service.
Score each gap by size, cost and ease of change before assigning effort. A small gap on a high-cost metric often deserves more attention than a large gap on a metric that barely moves service or margin. Revisit the grid after each review, because easy wins disappear and the harder projects move forward as capacity frees up.
Fleet and maintenance benchmarks: the often-missing layer
Measures to include
- Vehicle availability at the start of each shift.
- PM schedule compliance and overdue inspections.
- Unplanned downtime hours and breakdowns per vehicle.
- Maintenance cost per vehicle and per kilometer.
- Ratio of planned to reactive work.
- Spare vehicle ratio needed to cover downtime.
Why they change the story
- A strong cost per parcel can hide a worn fleet and deferred repairs.
- Low availability forces extra spare vehicles, raising cost elsewhere.
- Breakdowns drive failed deliveries and overtime that appear in service metrics.
- Maintenance data explains why two similar routes perform differently.
Compare like with like on age and duty
A fleet of new electric vans and a fleet of ten-year-old diesel vans have very different maintenance profiles. Segment by vehicle type, age and daily duty cycle before judging maintenance cost or availability against any peer.
Lock down KPI definitions before collecting data
| KPI | Common formula | Definition decisions to agree |
|---|---|---|
| On-time delivery rate | Deliveries inside the promised window divided by total deliveries attempted | Which window counts, whether customer-caused delays are excluded, and whether the clock stops at arrival or handover |
| First-attempt success | Parcels delivered on the first try divided by parcels first attempted | Treatment of safe-place drops, locker deliveries and customer-rescheduled parcels |
| Cost per parcel | Total delivery cost for the period divided by parcels delivered | Cost boundary, treatment of returns, and whether failed attempts are counted once or twice |
| Stops per hour | Completed stops divided by paid or driving hours | Whether breaks, loading and return time are included, and how multi-parcel stops are counted |
| Vehicle availability | Vehicles cleared to run divided by vehicles on the roster at shift start | Whether spare vehicles and vehicles in planned service count, and how partial-day downtime is treated |
| PM compliance | Preventive tasks completed within their window divided by tasks due | Size of the allowed window, whether inspections count, and how deferrals are recorded |
Write each definition on one page and share it with every depot and any peer you exchange data with. Most benchmark disputes are really definition disputes, so date each definition, store it where every depot manager can find it, and flag any change so old and new figures are never silently compared.
Set targets as ranges, not single numbers
A single-number target
- Implies a precision the benchmark cannot support.
- Ignores differences in density and service level between depots.
- Encourages gaming once the number becomes a bonus metric.
A target range with context
- States a floor, a goal and a stretch level for each depot profile.
- Explains the constraints behind each range.
- Is paired with a counter-metric, such as pairing speed with damage rate.
A reporting cadence that keeps benchmarks alive
Depot huddle
Review a handful of operational KPIs, including vehicle availability and overdue inspections, against the depot's own target range.
Network review
Compare depots with each other, explain outliers and check progress on open improvement actions.
Trend and cause review
Look at multi-month movement, separate seasonal effects and decide where to invest next.
External benchmark
Refresh peer comparisons, revisit the peer set and reset target ranges for the year ahead.
Internal benchmarking between depots
What to compare
- Depots with similar density, vehicle mix and service level.
- The best and worst quartile of routes within one depot.
- The same depot before and after a process change.
- Shift patterns, such as early versus late dispatch.
How to use the findings
- Document what the strongest depot does differently, then test it elsewhere.
- Treat unusual results as questions, not accusations.
- Share maintenance practices as well as routing practices.
- Recognize depots that improve, not only those that lead.
Internal data is the fastest place to learn
You already hold data on every depot. Comparing it carefully costs little, needs no external agreement and often reveals the largest and easiest gaps, such as one site with chronic PM backlog or higher breakdown rates on similar routes.
Common benchmarking mistakes
Comparing averages only
Averages hide the spread between depots. Look at the best and worst internal locations too.
Ignoring definitions
An on-time rate measured at the door differs from one measured at the customer promise window.
Benchmarking once
A single snapshot goes stale as networks and customer expectations shift. Repeat on a regular cycle.
Targets without owners
A gap with no named owner and date will still be a gap at the next review.
Gaming the metric
Pressure on a single number can push teams to hide failed attempts or defer maintenance. Balance each metric with a counterweight.
Copying methods blindly
A practice that works in a dense city may fail in a rural network. Test before scaling.
Using benchmarks inside the business
For operations leaders
Set depot targets as ranges, show progress against peers and explain where local constraints justify a gap.
For finance
Link each gap to a cost estimate and a payback case, so improvement work competes fairly for budget.
For customers and partners
Use anonymized comparisons in service reviews and tenders to show where you perform strongly and what you are fixing.
Where Oxmaint supports the fleet side
Oxmaint records preventive maintenance, work orders, inspections, asset history and inventory, then reports compliance, backlog, downtime and cost through dashboards. That gives you consistent fleet and depot figures to compare with peers and track after each improvement.
Frequently asked questions
Which KPIs should a delivery operation benchmark first?
Start with on-time rate, first-attempt success, cost per parcel and fleet availability. These cover service, cost and capacity and are widely measured.
How do I compare cost per parcel fairly with another operation?
Align the cost boundary, then adjust for stop density, parcel profile and service level. Compare components such as labor and vehicle cost, not only the total.
Are fleet maintenance metrics worth including in a benchmark?
Yes. Availability, PM compliance and unplanned downtime explain many service and cost gaps. A system such as Oxmaint can supply them consistently.
How often should we repeat benchmarking?
Most operations review annually for external peers and monthly for internal depot comparisons. Repeat sooner after major network or fleet changes.
What if we cannot find comparable peer data?
Benchmark internally across depots and against your own history, then join a peer exchange group over time. You can book a demo to see fleet reporting that supports this.
Turn comparisons into improvements
Measure the fleet and depot figures behind your delivery KPIs consistently, then act on the gaps. Oxmaint helps maintenance and operations teams report availability, compliance and cost with confidence.