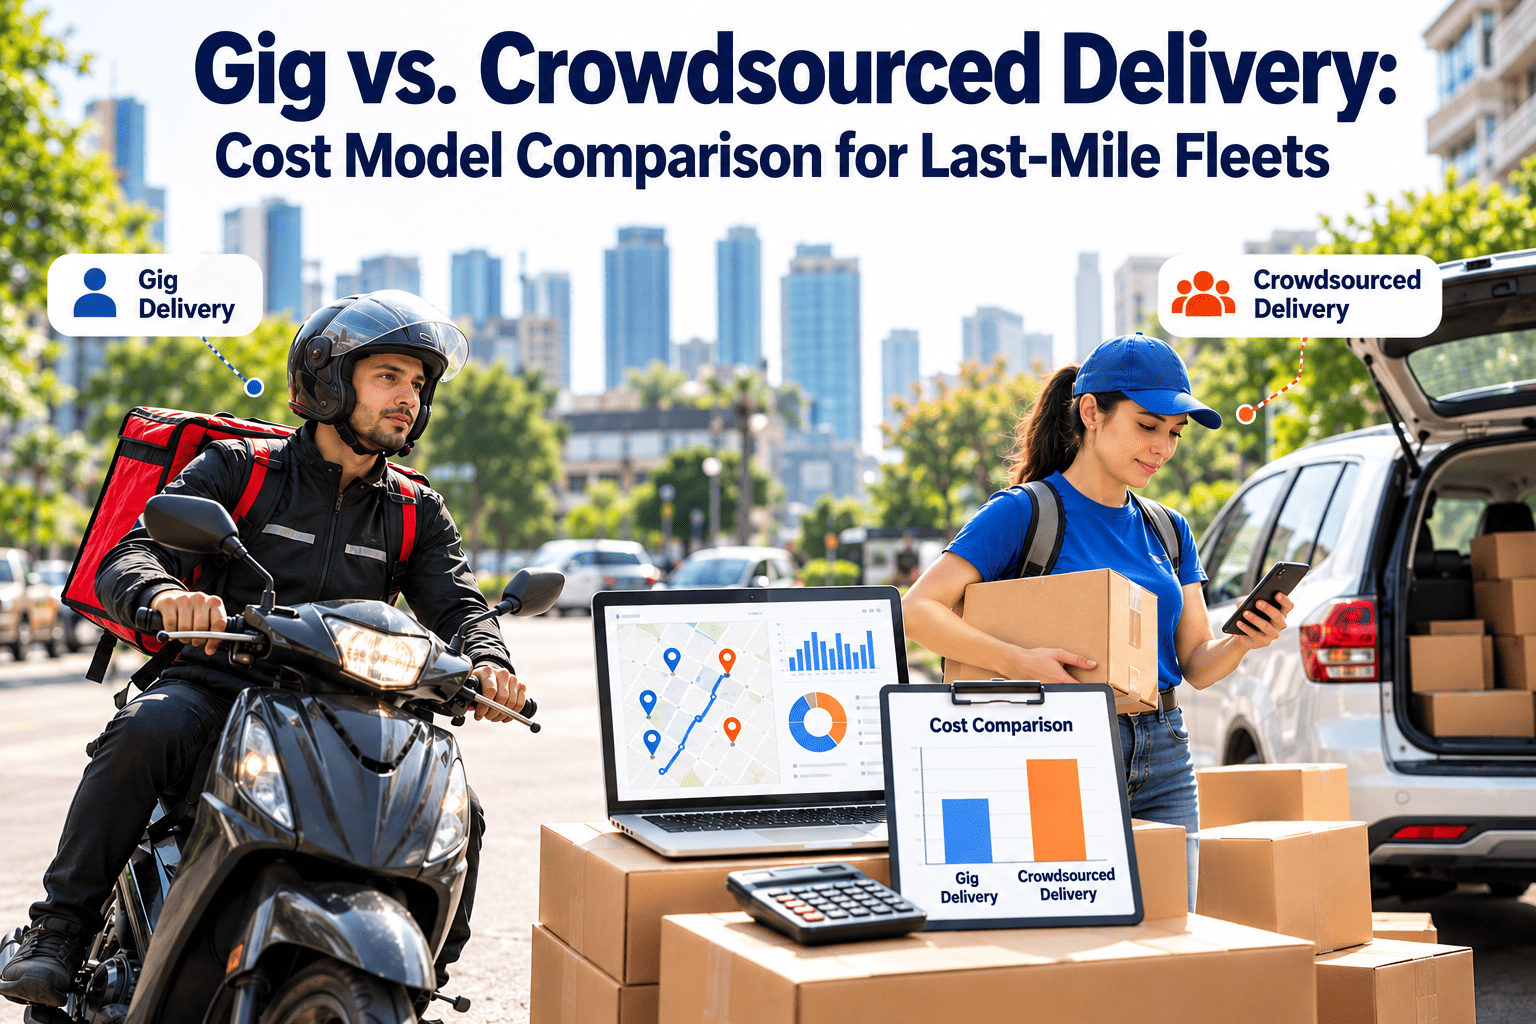
Gig and crowdsourced delivery look inexpensive on a per-stop rate card, but the full cost of a last-mile model also includes insurance, failed attempts, supervision, quality control, and the cost of being short on capacity at peak. In-house fleets have the opposite problem: high fixed cost that sits idle between peaks. Choosing a model means putting both on the same basis. This comparison breaks down the economics of gig, crowdsourced, contract carrier, and in-house delivery, and shows how a mixed model works alongside maintenance management software for the vehicles you own.
Gig vs. Crowdsourced Delivery: Cost Model Comparison for Last-Mile Fleets
Compare the true cost of gig, crowdsourced, contract carrier, and in-house delivery, including the hidden costs that rate cards leave out.
Four Delivery Models in Plain Terms
The labels overlap in practice, so compare how each arrangement handles labor, vehicles, insurance, and service accountability rather than relying on the name.
Visible Cost Versus Hidden Cost
A per-delivery rate is only the top layer. The layers below it decide whether a model is actually cheaper.
The lower layers are easy to underestimate because they appear in different budgets, such as customer service, legal, and operations.
Cost Model Comparison Table
Use this table as a starting framework. Fill each cell with your own contract rates and internal costs.
| Cost factor | In-house | Contract carrier | Gig platform | Crowdsourced |
|---|---|---|---|---|
| Labor | Wages, benefits, payroll tax | Built into carrier rate | Per block or per delivery | Per task |
| Vehicle | Owned or leased, fully yours | Carrier supplies | Driver supplies | Driver supplies |
| Fuel and wear | Company cost | In rate | Driver cost, reflected in pay needs | Driver cost, reflected in pay needs |
| Insurance | Fleet policy | Carrier policy | Platform or driver policy, check coverage gaps | Often thin, check carefully |
| Fixed cost | High | Low to medium | Low | Very low |
| Capacity at peak | Limited by fleet | Negotiated | Strong, not guaranteed | Strong, volatile |
| Quality control | Direct | Contract terms and audits | Ratings and rules | Ratings, hard to enforce |
| Brand experience | Full control | Partial | Partial | Limited |
| Maintenance burden | Yours | Carrier | Driver | Driver |
Break-Even Thinking: Fixed Versus Variable
In-house delivery is fixed-cost heavy and gets cheaper per stop as volume rises. Gig and crowdsourced delivery are variable-cost heavy and scale linearly. The break-even point sits where the two lines cross.
- Gig rate: 8.00 per delivery
- In-house fixed cost: 1,200 per route per day
- In-house variable cost: 3.00 per delivery
- Break-even: 1,200 divided by 5.00 = 240 deliveries per day
- Below that, the gig model is cheaper
- Above that, in-house is cheaper
These figures are only for illustration. Real break-even also depends on failed-delivery rates, service level, and how reliably volume repeats each day.
Know the Cost of the Vehicles You Own
Where you run in-house or leased fleets, maintenance cost belongs in the model. Track cost per vehicle, downtime, and planned service in one place.
Hidden Costs Most Comparisons Miss
Worker classification and compliance
- Rules on independent contractor status differ by country and region and continue to change.
- Misclassification can create back pay, tax, and benefits exposure.
- Review contracts with legal advice before scaling any gig model.
- Document how drivers are engaged, paid, and directed, since those facts often decide how a relationship is treated.
Insurance gaps
- Personal auto policies often exclude commercial delivery use.
- Platform coverage may apply only while a delivery is active.
- Cargo and damage liability can be unclear for high-value parcels, so confirm who pays before a claim occurs.
- Ask for certificates of insurance and check their expiry dates regularly.
Service reliability
- Drivers can decline tasks or log off at the busiest time.
- Quality varies between drivers, so complaints and redeliveries rise, and each repeat visit adds cost that was not in the original quote.
- New drivers need app training and area knowledge, which adds failed attempts.
Management overhead
- Support teams handle customer contacts, driver disputes, and payment queries.
- Fraud, no-shows, and proof of delivery disputes need dedicated process.
- Data flows between your systems and the platform need ongoing upkeep.
Risk Versus Cost at a Glance
Place each model on the grid below using your own data. The position shows the trade-off, not a ranking.
KPIs for Comparing Models Fairly
| KPI | Why it matters | How to compare |
|---|---|---|
| Fully loaded cost per delivery | Combines rate, insurance, support, and failures | Same formula across every model |
| First-attempt success rate | Failed attempts add cost and hurt customers | Track by model and by zone |
| On-time rate | Tests reliability at peak | Compare normal days and peak days |
| Damage and claim rate | Reveals quality and insurance exposure | Claims per thousand deliveries |
| Support contacts per delivery | Shows hidden management cost | Tag contacts by delivery model |
| Vehicle downtime hours | Matters for owned fleets | Track unplanned versus planned |
A Layered Mix Strategy
Most mature operations do not choose one model. They size each layer to the kind of demand it handles best.
Size the base layer to the volume you can serve on most days, not to your busiest day. Idle fixed capacity is what makes in-house delivery expensive.
Where Maintenance Fits in the Model
Any model that uses vehicles you own or lease carries maintenance cost. Oxmaint is maintenance management software, so it applies to the in-house layer of your delivery mix.
- Preventive maintenance schedules by mileage, hours, or calendar date.
- Work orders for repairs, with labor, parts, and cost recorded per vehicle.
- Mobile pre-trip inspection checklists for drivers.
- Asset records showing service history for each vehicle.
- Inventory tracking for tires, filters, and fast-moving parts.
- Reports on downtime and maintenance cost per vehicle, which feed directly into cost per delivery.
With these records, the in-house cost in your break-even calculation comes from actual data rather than an estimate.
How to Choose a Model: Decision Steps
Trends Shaping the Delivery Workforce Mix
- Regulation: rules on contractor status and platform responsibility are evolving in many markets, so review legal exposure regularly.
- Electrification: owned fleets moving to electric vans add charging and battery tasks to maintenance planning.
- Data visibility: operators increasingly expect live tracking and proof of delivery from every model, including third parties.
- Density focus: consolidating routes raises the value of owning efficient, reliable vehicles for the base layer.
- Customer expectations: narrower windows push operators to keep more control over service-critical routes.
- Cost transparency: finance teams now ask for cost per delivery by model, which requires consistent tracking of maintenance, insurance, and failed attempts.
- Hybrid networks: operators are combining lockers, carriers, and owned fleets, so each model needs to be measured on the same terms.
Delivery Model Questions
Peak Season and Demand Volatility
Peak planning is where gig and crowdsourced models earn their place, and where their weaknesses show most clearly.
An owned fleet that breaks down in peak week is the most expensive failure, because there is no spare capacity left to absorb it.
Contract Terms Worth Negotiating
Whichever external model you use, the contract decides where risk sits.
- Service level targets for on-time and first-attempt success, with clear remedies when they are missed.
- Insurance requirements, including cargo, liability, and proof of coverage for every driver.
- Data access: delivery events, proof of delivery, and exceptions in a format you can use.
- Liability for damaged, lost, and mis-delivered parcels, and how fast claims are settled.
- Rate structure at different volumes, including peak surcharges and minimum commitments.
- Exit terms, so you can shift volume without penalty if quality falls.
- Brand and conduct rules, including uniforms, communication, and handling of customer complaints.
Negotiating these terms early prevents disputes over cost later, when volume is already committed.
Pilot Scorecard Before You Scale
Run any new model in one zone for several weeks and score it against your current operation.
| Measure | Current model | Pilot model | Decision rule |
|---|---|---|---|
| Fully loaded cost per delivery | Baseline | Measured | Pilot must beat baseline after all costs |
| First-attempt success | Baseline | Measured | No decline in customer outcomes |
| On-time rate on peak days | Baseline | Measured | Holds under heavy load |
| Support contacts | Baseline | Measured | No sharp increase per delivery |
| Damage and claim rate | Baseline | Measured | Equal or lower |
| Driver availability | Baseline | Measured | Covers the whole shift window |
Common Mistakes in Delivery Model Decisions
- Comparing a rate card with a fully loaded in-house cost
- Ignoring failed deliveries and support contacts
- Sizing the owned fleet for the busiest day
- Skipping vehicle service to keep routes running
- Moving all volume to one model at once
- Putting every model on the same cost basis
- Counting service failures as a cost
- Sizing the fleet for steady demand and flexing for peaks
- Scheduling maintenance around low-volume days
- Piloting, measuring, then scaling gradually
Building a Fully Loaded Cost per Delivery
The same formula should be applied to every model so the comparison is fair.
How to estimate each term
- Direct cost: invoices from carriers or platforms, or wages and vehicle cost for in-house routes.
- Insurance: premiums, deductibles, and the average cost of claims over a year.
- Management: share of dispatch, support, and finance time spent on each model.
- Failure cost: failed attempts multiplied by the cost of a repeat visit or refund.
- Maintenance: recorded repair and service cost for owned vehicles, from your maintenance system.
Dividing by successful deliveries, not attempted ones, makes failed attempts show up in the number where they belong.
Data You Need From Every Model
You cannot manage what you cannot see. Ask every external partner for the same event data you collect from your own drivers.
- Time of pickup, arrival, and completion for every stop.
- Proof of delivery, including photo or signature where relevant.
- Reason codes for every failed attempt.
- Customer contact records linked to the delivery.
- Damage and loss reports with timestamps.
- Driver or vehicle identifiers, so quality problems can be traced.
Consistent data makes the quarterly review a measurement exercise instead of an argument between operations and finance.
Make the In-House Side of Your Mix Cost Less to Run
Compare delivery models with real numbers. Use Oxmaint to schedule preventive maintenance, run inspections, and track cost per vehicle for the fleet you own.