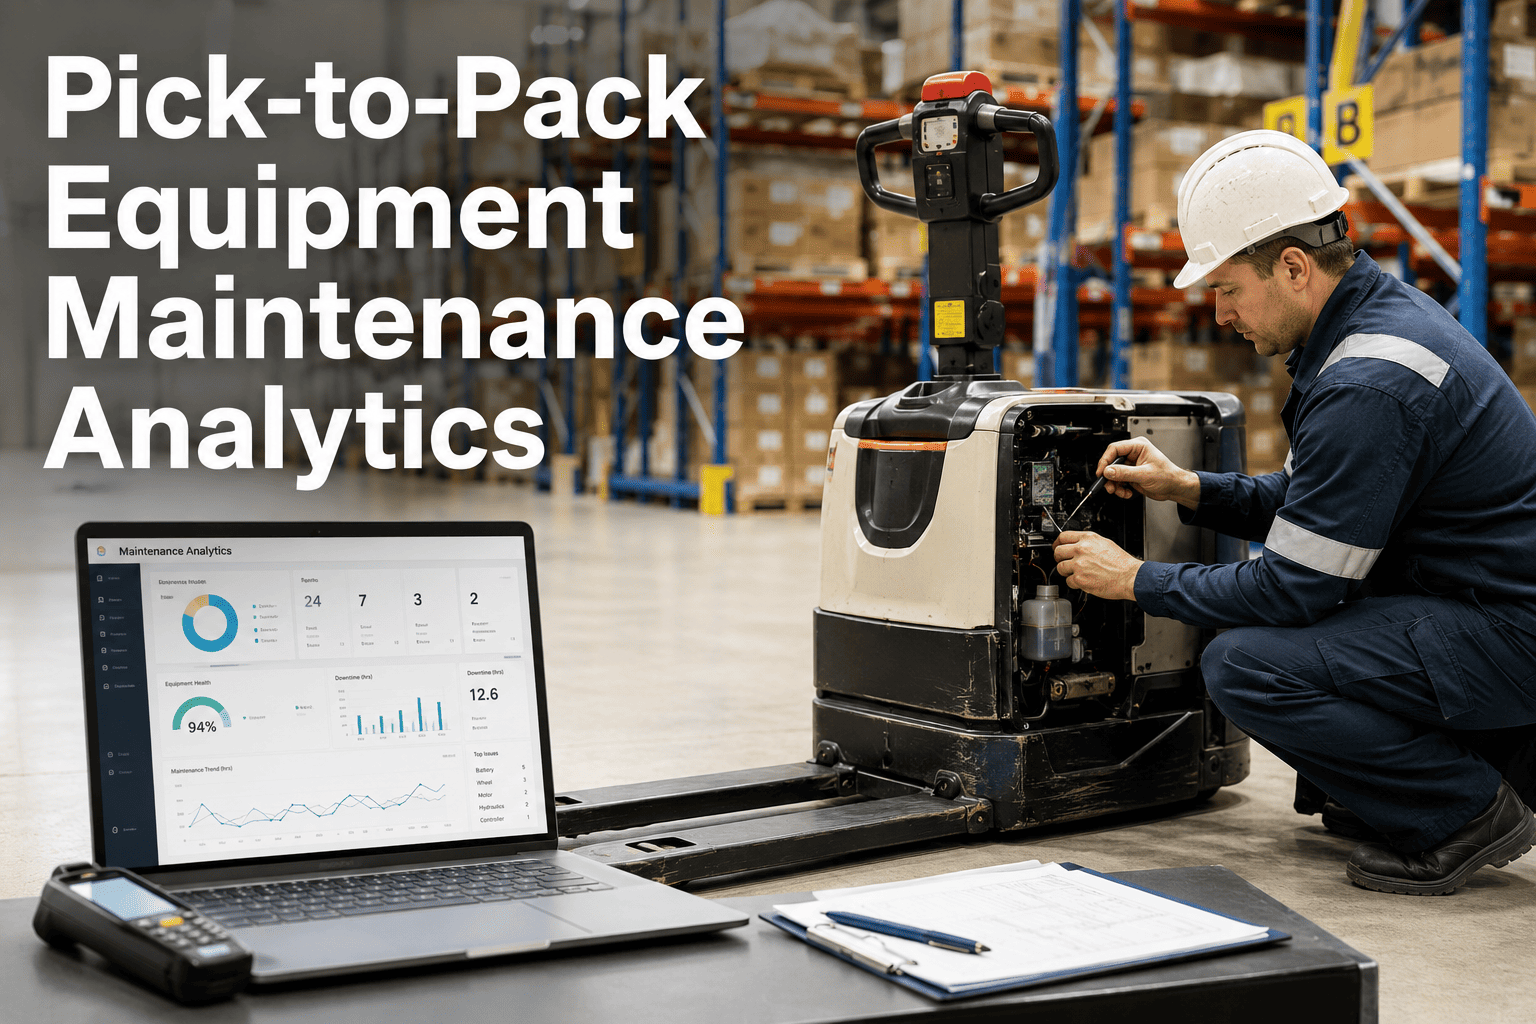
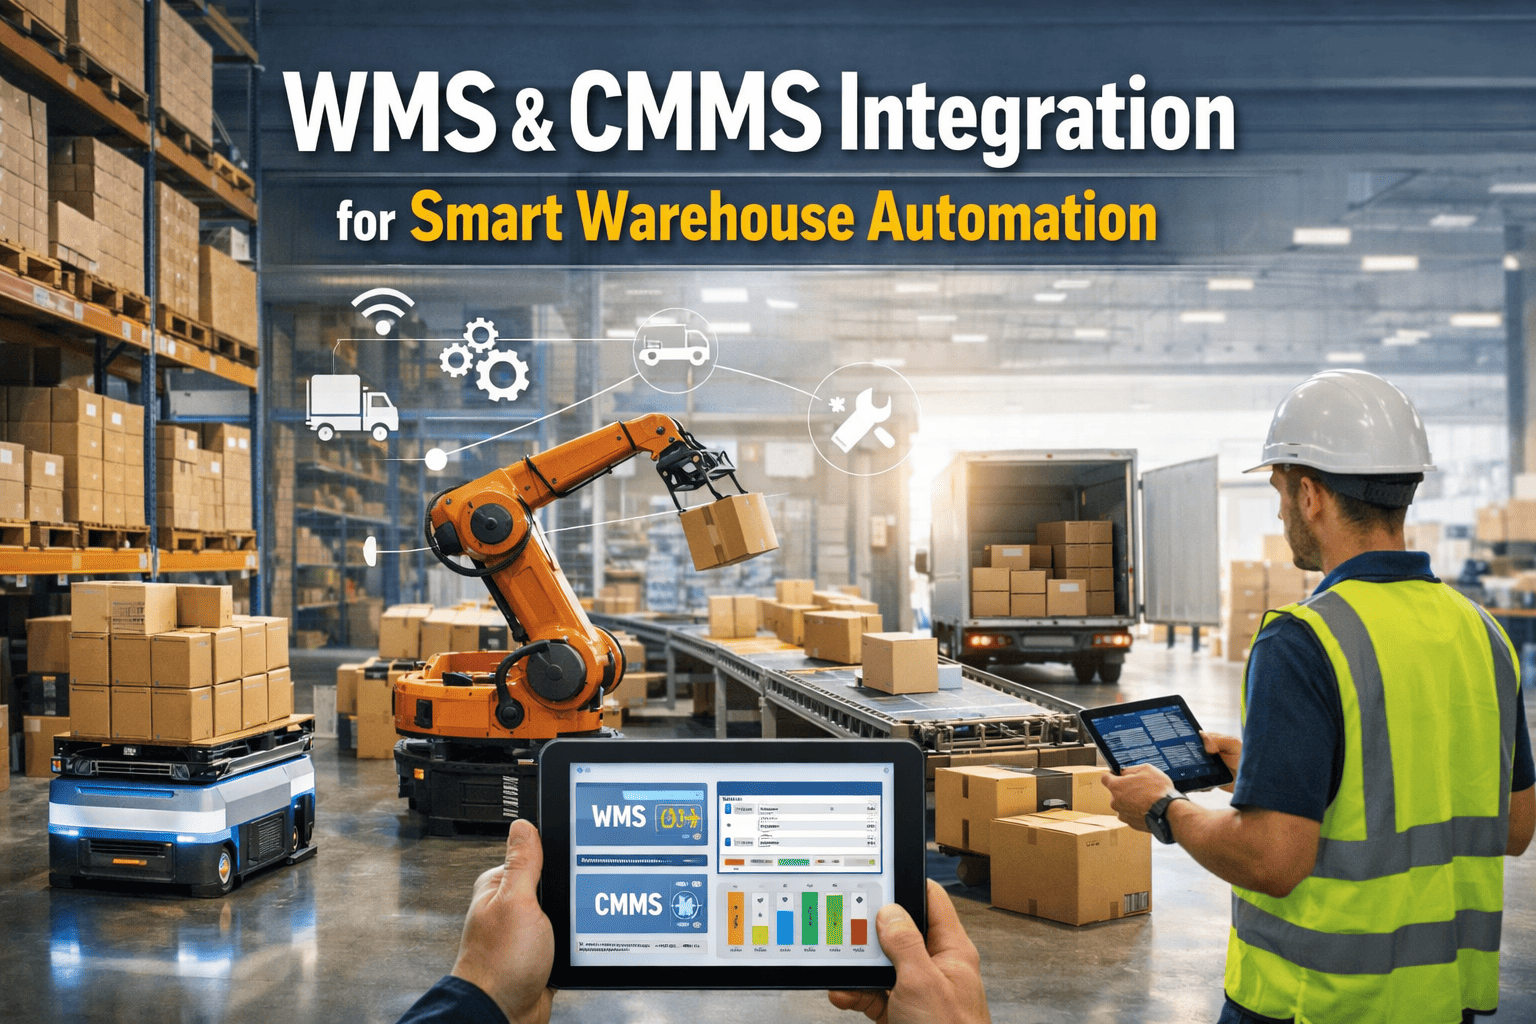
Pick-to-pack lines are the tightest bottleneck in any fulfillment center — a single conveyor jam or sensor failure during peak hours can push an entire shipping cutoff. Oxmaint turns scattered equipment data into maintenance analytics that show exactly which pick stations, scales, and packing arms are trending toward failure before they cause a missed cutoff. If your team is still reacting to downtime instead of forecasting it, book a consultation to see what analytics-driven maintenance looks like on your floor.
Analytics & Reporting — Pick-to-Pack
Every Pick-to-Pack Stoppage Has a Pattern. Most Teams Never See It.
Failure data sits scattered across paper logs, technician memory, and disconnected spreadsheets — until it's turned into analytics that point to the next likely breakdown.
Downtime Causes — Pick-to-Pack Lines
The Visibility Gap
Why Most Teams Can't See the Pattern Until It's Too Late
A pick-to-pack line generates failure signals constantly — minor jams, sensor faults, recurring resets. Individually, each looks like routine noise. Tracked over weeks, the same station failing every Tuesday afternoon shift is a maintenance pattern, not bad luck. Without analytics tying these events together, that pattern stays invisible until the line goes down during a cutoff window.
Without Analytics
Failures logged as isolated tickets, no pattern linkage
Same station fails repeatedly, treated as a new issue each time
Root cause investigation starts after the third or fourth failure
Parts ordered reactively, often expedited at premium cost
With Oxmaint Analytics
Failure history grouped by asset, shift, and root cause category
Recurring station failures flagged after the second occurrence
Root cause surfaced from pattern, not guesswork, within days
Replacement parts pre-positioned ahead of predicted failure window
A missed shipping cutoff costs more than the part that caused it.
Oxmaint analytics connect every pick-to-pack failure back to its asset, shift, and root cause — so the next likely breakdown is visible weeks before it happens.
Analytics in Practice
Three Reports That Change How Teams Plan Maintenance
1
Mean Time Between Failure, by Station
Ranks every pick station by how often it fails relative to its peers, surfacing the 10–15% of stations responsible for most unplanned downtime.
2
Shift-Pattern Failure Heatmap
Maps failures against time of day and shift, revealing whether breakdowns cluster around peak volume hours or specific operator handoffs.
3
Parts Consumption vs. Failure Forecast
Compares historical parts usage against predicted failure timing, so replacement components arrive before the line goes down, not after.
Impact Snapshot
What Changes After 90 Days of Analytics-Driven Maintenance
| Metric | Before Analytics | After 90 Days |
| Unplanned line stoppages per week |
8–12 |
3–5 |
| Average time to identify root cause |
3–4 failure events |
1–2 failure events |
| Expedited parts orders per month |
High, reactive |
Reduced via pre-positioning |
| Missed shipping cutoffs from equipment |
2–3 per month |
Under 1 per month |
Expert Review
"Fulfillment teams often have plenty of data — the gap is connecting it. A jam logged at 2pm and another at the same station at 2pm the next day are the same problem if anyone looks. Analytics that group failures by asset and shift turn three months of scattered tickets into a maintenance plan." — Reviewed by Oxmaint's Reliability Engineering team, based on fulfillment center deployment data.
FAQ
Questions on Pick-to-Pack Maintenance Analytics
How much historical data is needed before analytics become useful?
Pattern detection starts showing value after 4–6 weeks of logged work orders and failure events. Stations with recurring issues surface even sooner, often within the first two weeks.
Book a consultation to discuss your current data volume.
Can analytics pull data from existing sensors on pick stations?
Yes. Oxmaint ingests data from scale sensors, print head diagnostics, and conveyor controllers via standard integration protocols, combining it with work order history for a complete failure picture.
Do reports update automatically or require manual generation?
Reports refresh continuously as new work orders and sensor data come in, so the MTBF rankings and shift heatmaps always reflect current conditions rather than a static snapshot.
Start a trial to see live reporting.
Can this work across multiple fulfillment centers at once?
Yes, analytics can be filtered per site or rolled up across a network, helping operations leaders compare which centers have higher recurring failure rates and where to focus maintenance investment.
Your pick-to-pack data already contains the answer. It just needs to be connected.
Oxmaint turns scattered failure logs into station-level analytics that forecast the next breakdown before it threatens a shipping cutoff.