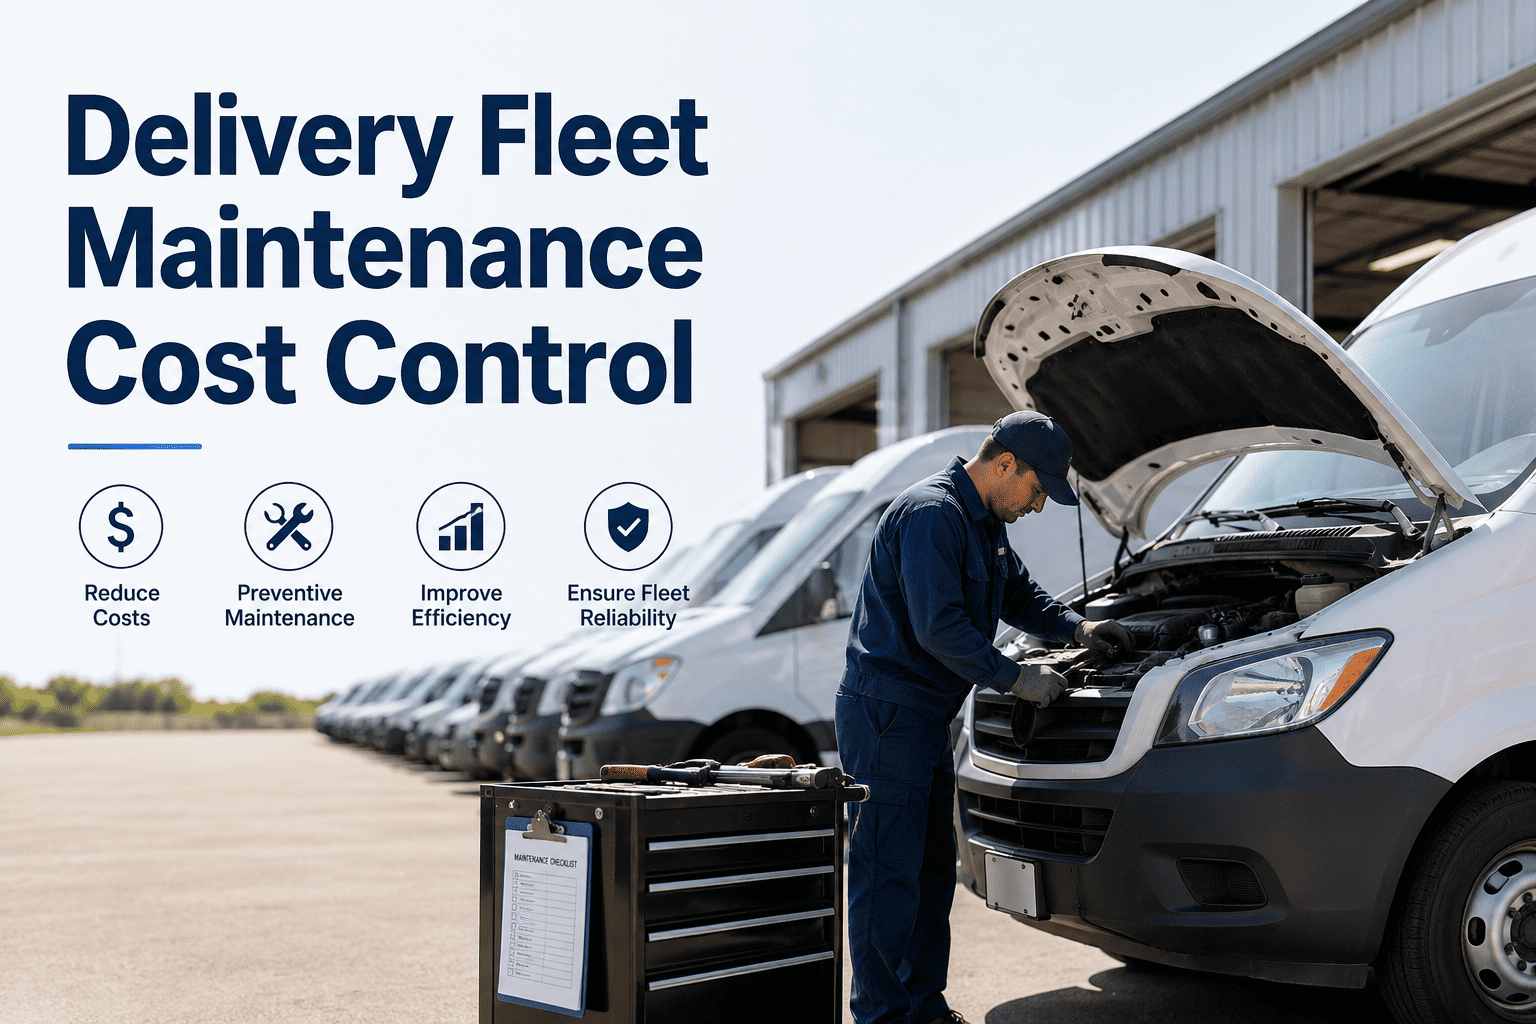
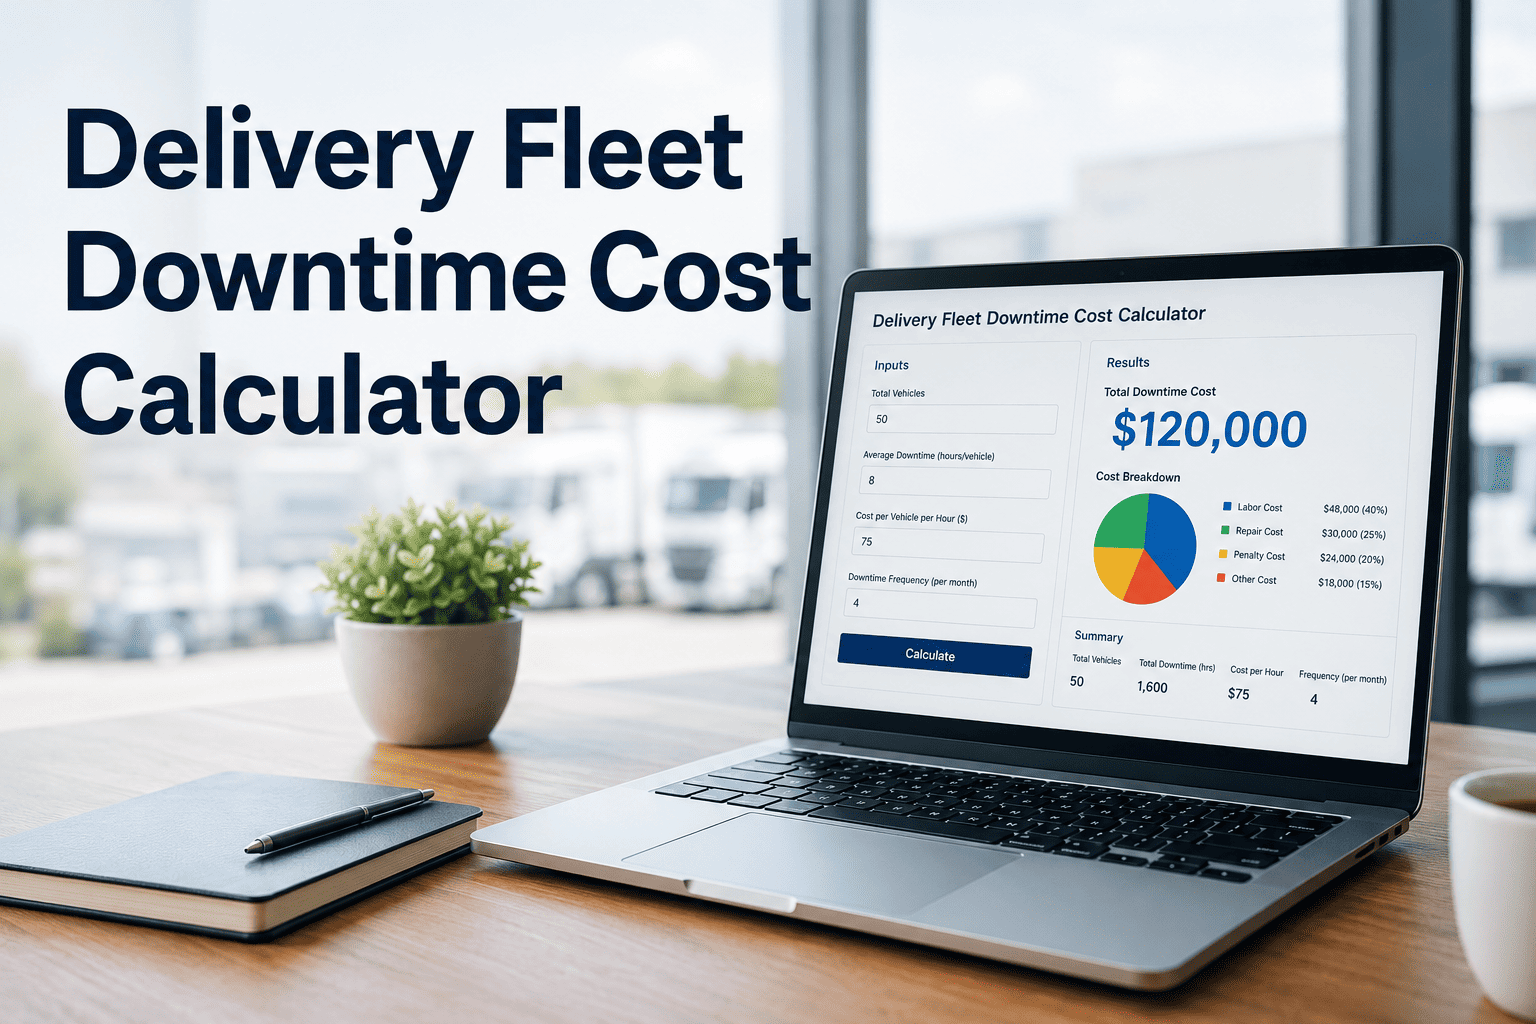
Emergency repairs cost three to five times more than the same job done as planned maintenance. The premium is not just parts and labour — it is the emergency order surcharge, the overtime call-out rate, the lost route revenue, and the missed delivery penalty. Most fleet operators know reactive maintenance is expensive. Very few have ever added it all up. This page does that calculation and shows how OxMaint eliminates the emergency repair cycle entirely.
The True Cost of a Single Emergency Breakdown: Every Line Item
Fleet managers typically log the cost of an emergency repair as the parts and labour cost on the work order. This understates the true cost by 60–80%. The full emergency breakdown cost includes six cost lines that are rarely captured in a single record — but all of which represent real money leaving the business. Start free — OxMaint tracks all six cost categories per vehicle to give you a true emergency repair cost figure.
Six Hidden Emergency Cost Categories Most Fleet Managers Never Total Up
Emergency repairs do not appear as a single line item in any accounting system. They are spread across six budget categories — parts, labour, vehicle standing time, logistics, customer relations, and administration — each recorded separately, so the total is never seen in one place. This invisibility is exactly why reactive maintenance spending persists: nobody has added it up. OxMaint's cost analysis module consolidates all six categories per vehicle per year so the total is impossible to ignore. Book a demo to see your fleet's consolidated emergency repair cost analysis in one view.
Reactive vs Predictive: Eight Operational and Financial Differences
The shift from reactive to predictive maintenance is not a software decision — it is a financial strategy. Predictive maintenance costs less not because parts are cheaper, but because the work is scheduled at the lowest-cost point of the repair cycle: before failure, during normal operating hours, with the right parts already in stock. Every one of the eight differences below has a measurable cost attached to it. Start free and see your fleet's reactive vs predictive cost comparison within 30 days of OBD connection.
How Each Technology Layer Eliminates a Different Emergency Cost Driver
Emergency repairs do not have a single cause — they have five. OBD sensor degradation goes unacted on. A visual tyre defect is missed at gate departure. A PM schedule is set to a fixed calendar interval that does not match actual wear rate. A work order is raised on paper at 05:00 and not acted on until 10:00. Each of these failure points has a specific technology fix in the OxMaint stack. Connect all five technology layers and eliminate each emergency cost driver simultaneously — start free today.
Case Study: From $340K to $118K Emergency Repair Spend in 12 Months
A UK-based grocery distributor running 74 vehicles across two depots had a maintenance budget that consistently exceeded forecast by 28–34% per year. Their fleet manager had never been able to identify the root cause because the data existed in four separate systems. When OxMaint consolidated the full emergency cost picture for the first time, the number was stark: $340,000 per year in emergency repair costs across the fleet. Within 12 months of OxMaint deployment, that figure had dropped to $118,000. Book a demo to see a cost consolidation analysis built for your fleet's vehicle count and depot structure.
"I had been telling the board for two years that our maintenance budget was uncontrollable. OxMaint showed me in the first month that £186,000 of our annual maintenance spend was a premium we were choosing to pay by not acting on known fault signals. That framing changed everything — it was not an uncontrollable cost, it was an addressable one."