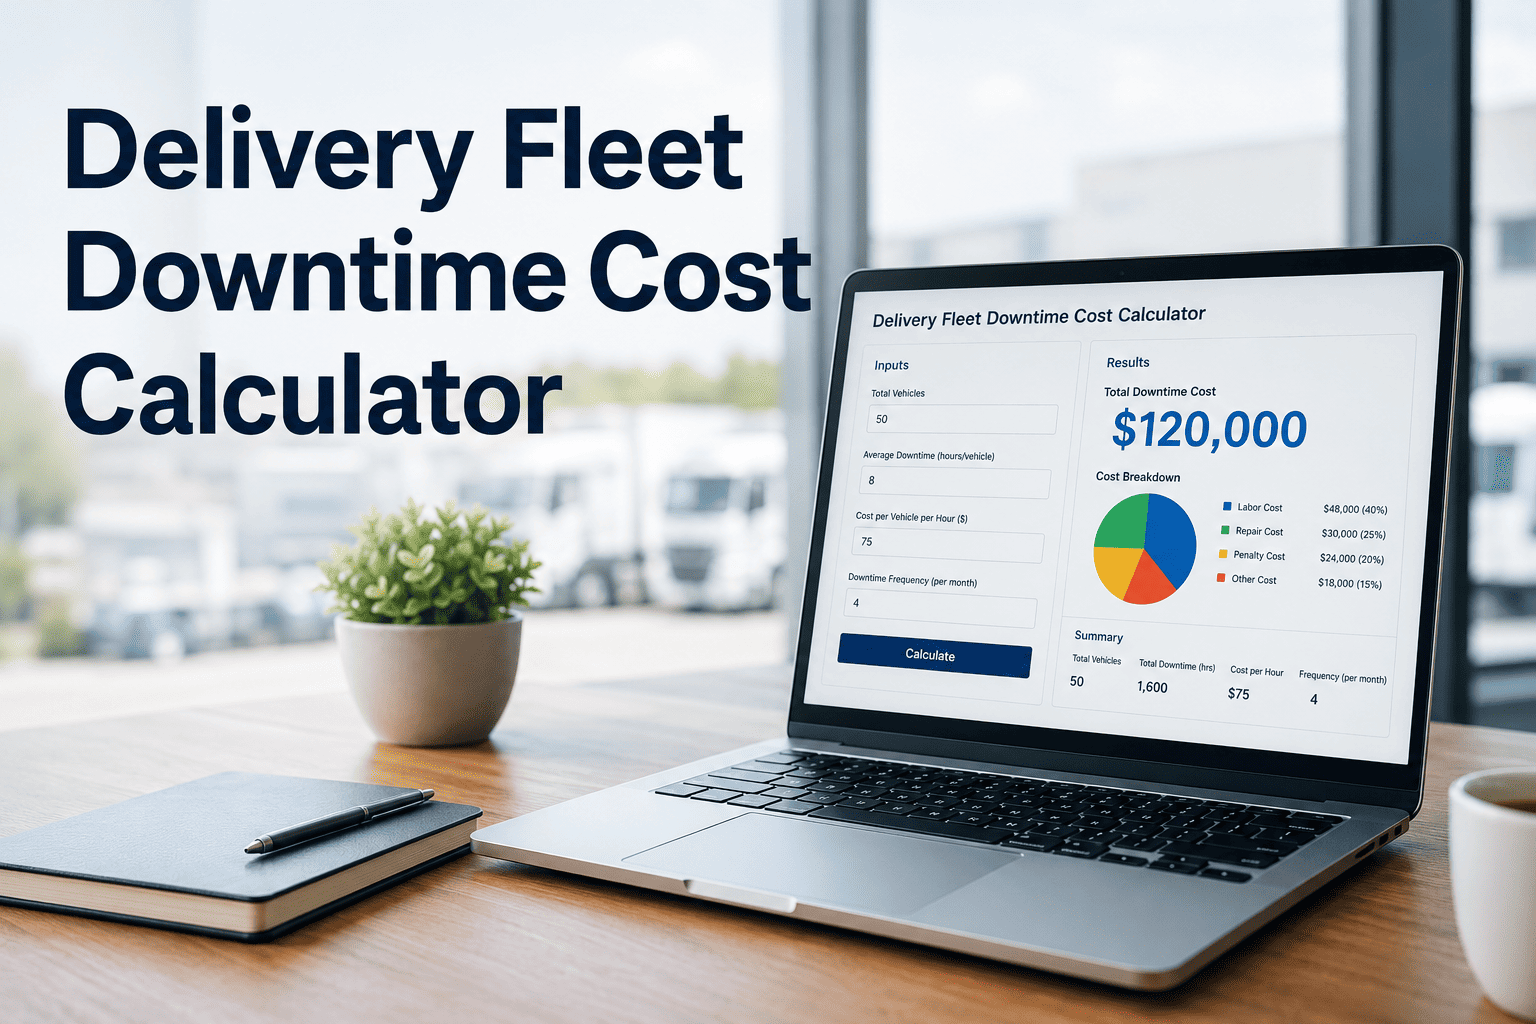
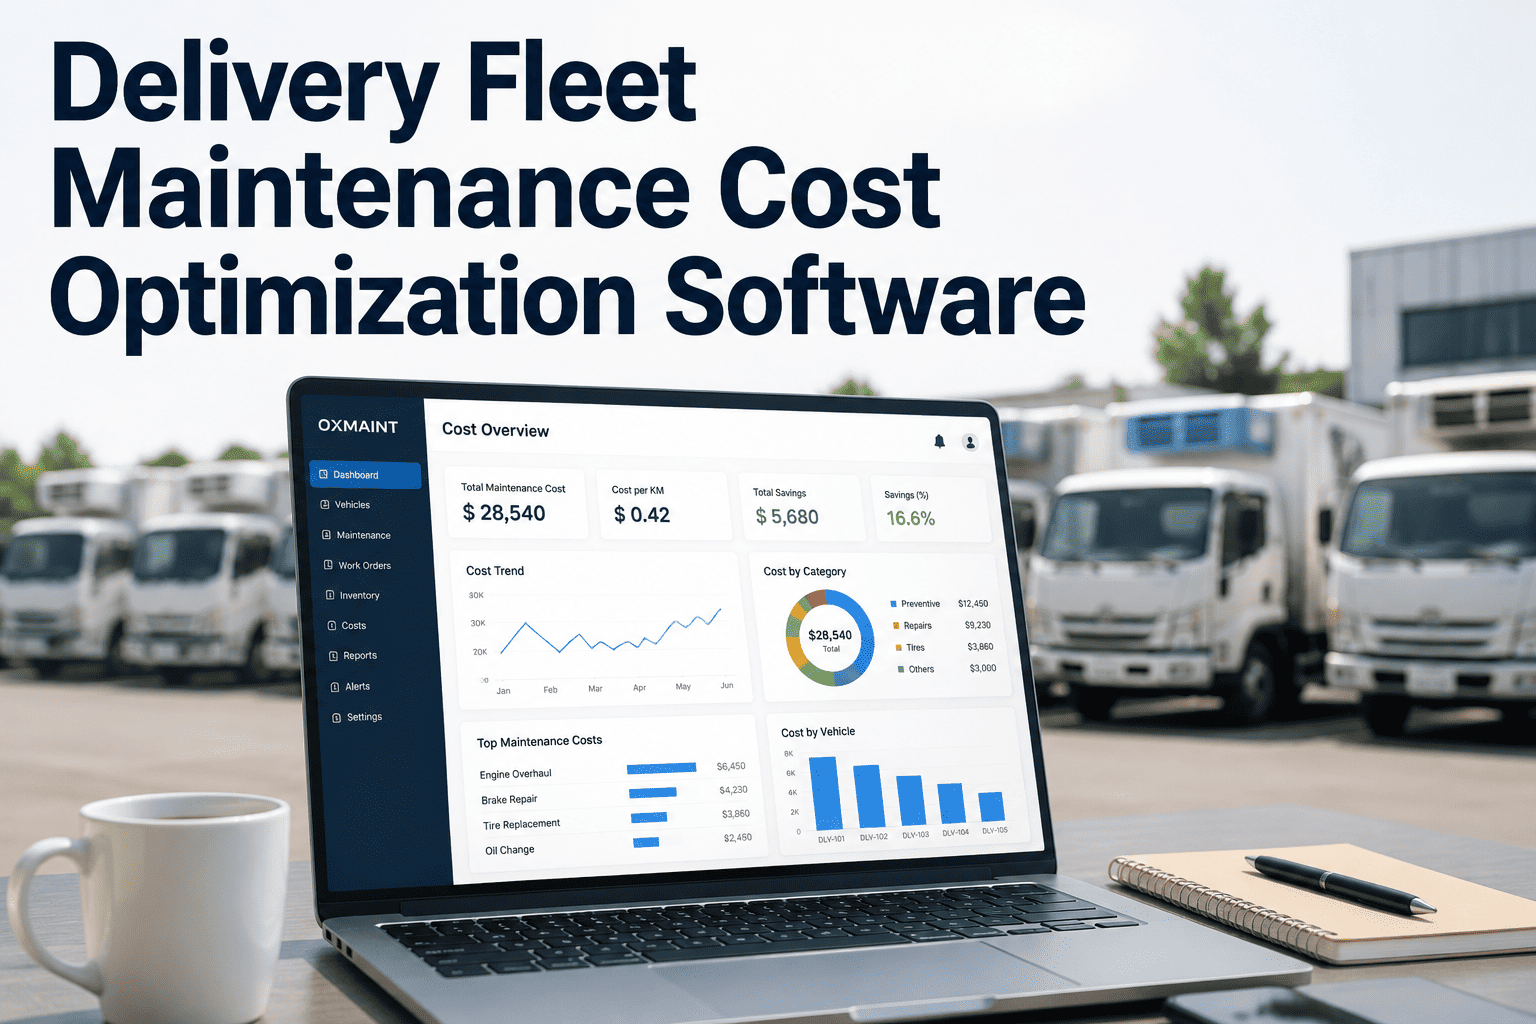
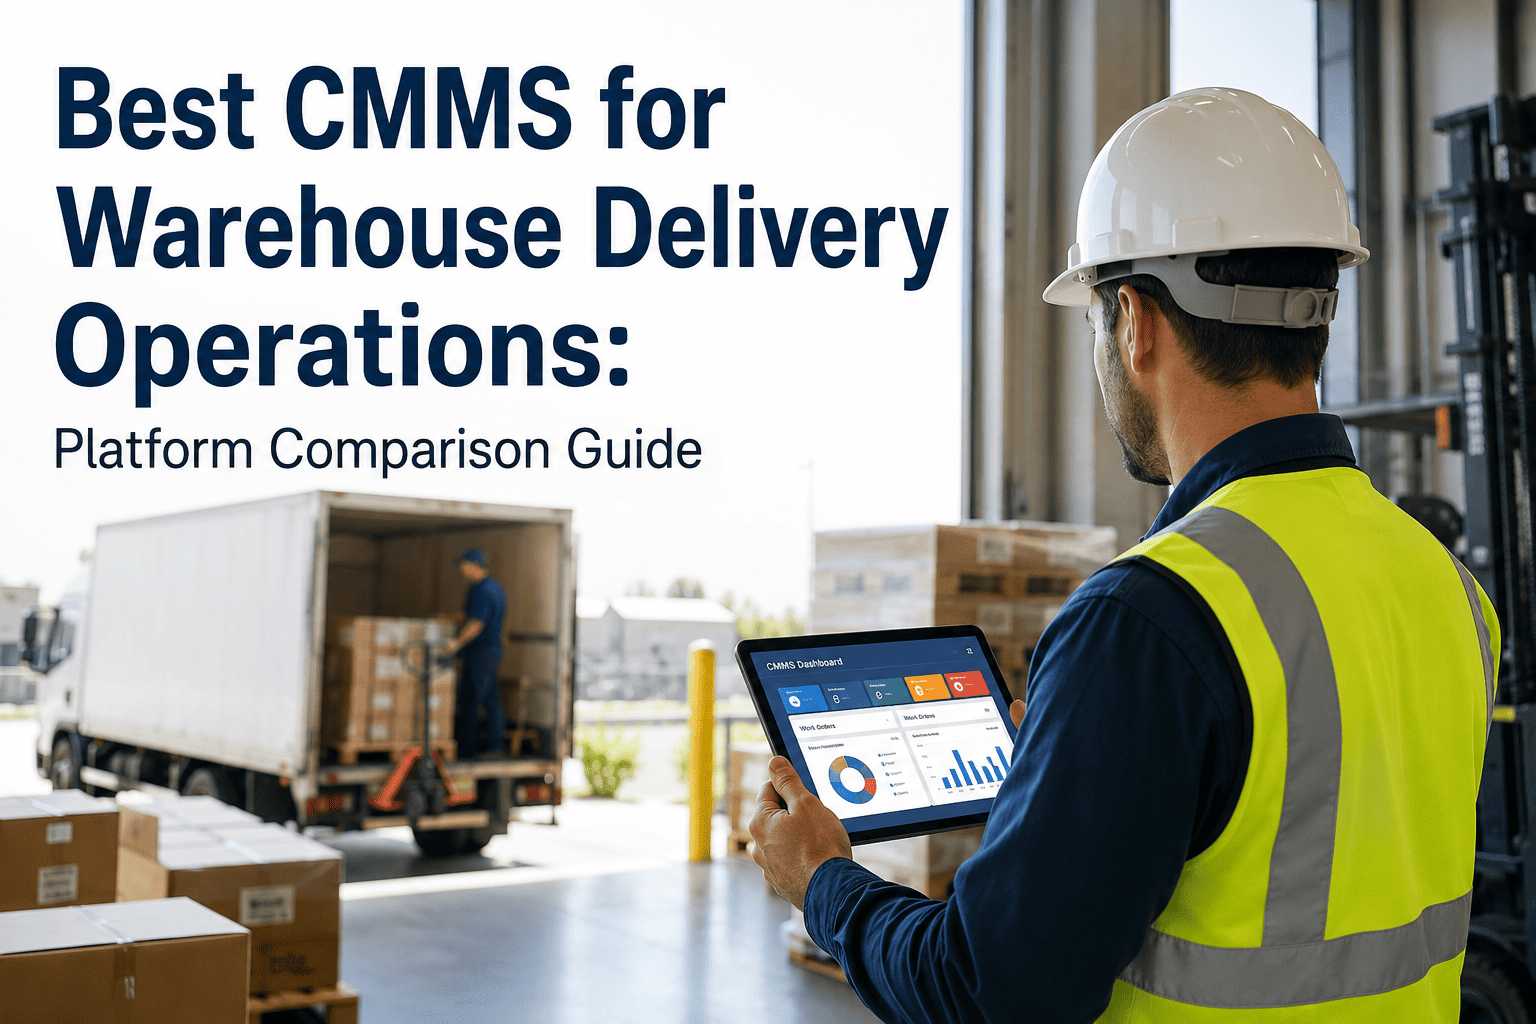
One delivery van breaks down on Tuesday morning. By 9:47 AM, dispatch is rerouting 22 stops across three other drivers, a tow truck is en route at $487, and your warehouse manager just got off the phone with a customer threatening to switch suppliers. That single breakdown will cost your operation somewhere between $1,200 and $4,800 before the day ends — and most fleet managers have no idea how to count it accurately. The real downtime bill isn't the repair invoice. It's the cascade: missed routes, idle drivers on the clock, emergency parts shipping at 4x markup, overtime to recover the schedule, and customers who quietly start shopping competitors. Use the calculator framework below to estimate your actual exposure — or start a free Oxmaint trial and let the system track downtime costs automatically against every work order, every vehicle, every route.
Delivery Fleet Downtime Cost Calculator
Your Last Breakdown Cost More Than You Think. Here's the Math.
Industry data places average delivery fleet downtime at $448 to $760 per vehicle per day — but that range hides emergency repair premiums, route penalty fees, and customer churn that pushes the real number to $1,000 or higher. Walk through the cost layers, run the numbers against your fleet, and see what reactive maintenance is actually costing your operation.
$760
Average daily downtime cost per vehicle
8.7
Unplanned downtime days per vehicle annually
32%
Downtime reduction with structured PM programs
Quick Reference
Delivery fleet downtime cost = (Daily Lost Revenue per Vehicle) + (Driver Idle Wages) + (Emergency Repair Premium) + (Route Recovery Costs) + (Customer Penalty Exposure). Multiply by frequency of unplanned events to get annualized impact. Most operators undercount by 40-60% because they only track the repair invoice — not the operational cascade behind it.
The Five Cost Layers Most Fleets Never Count
When a delivery van goes down mid-route, the repair line item on your maintenance ledger is just the visible tip of the cost iceberg. Five distinct cost layers compound underneath every unplanned downtime event, and most fleet managers track only the first two. Understanding all five is the difference between knowing your true cost per breakdown and operating with a blind spot that quietly drains 5-12% of your operating budget.
Layer 01
Direct Repair & Parts Cost
Typical Range: $800 – $6,000 per event
The repair invoice everyone sees. Parts, labor, diagnostics. For a box truck or delivery van, mechanical events average $800-$2,400 in-shop; major powertrain or aftertreatment failures push $4,000-$6,000. Emergency parts shipping adds 3-5x standard pricing when sourced for same-day completion.
Visible to: 100% of fleet managers
Layer 02
Lost Revenue & Productivity
Typical Range: $448 – $760 per vehicle per day
Every hour the van isn't delivering, revenue stops. Industry research places the standard at $448-$760/day per vehicle, with route-density and load-margin factors pushing it past $1,000. A driver earning $31.25/hr plus $48/hr in lost profit margin produces $79.33/hr in straight productivity loss before any cascading effects kick in.
Visible to: 60% of fleet managers
Layer 03
Emergency Service Premiums
Typical Range: $350 – $1,500 per event
Roadside assistance, emergency towing, and after-hours labor surcharges. Standard shop rates of $150-$200/hr balloon to $300-$500/hr for mobile or after-hours service. Weekend and holiday rates hit $500/hr at some shops. Towing alone runs $300-$1,500 depending on distance and equipment.
Visible to: 45% of fleet managers
Layer 04
Route Recovery & Overtime
Typical Range: $200 – $1,200 per event
When a van fails mid-route, 15-25 remaining stops get redistributed across other drivers. That means overtime wages, fuel for backtracking, dispatcher hours coordinating the rescue, and sometimes a rental at $150-$300/day to maintain coverage. Route-density operations see this layer hit hardest.
Visible to: 25% of fleet managers
Layer 05
Customer Penalty & Churn
Typical Range: $200 – $2,000+ per event
Missed delivery windows trigger contract penalties of $200-$2,000 depending on SLA terms. Beyond the penalty, repeated late deliveries cost relationships — last-mile and B2B operators report customer churn driven by reliability problems exceeds any single penalty by 3-5x in long-term revenue impact. This layer compounds invisibly.
Visible to: 12% of fleet managers
Total Real Cost of a Single Unplanned Breakdown
$2,300 – $12,500+
Most operators count only Layers 1 and 2 — missing 40-60% of actual exposure
Stop guessing. Start measuring.
Oxmaint Calculates Real Downtime Cost Against Every Work Order Automatically
Plug in your driver wages, route values, and SLA penalty rates once. From that point forward, every unplanned breakdown shows the true financial impact — repair cost, lost revenue, overtime exposure, and customer penalty risk on a single dashboard. No more spreadsheet guessing. No more hidden costs.
The Four-Step Downtime Cost Formula
Pull out your last three months of maintenance records and run them through this four-step formula. The output is your true cost-per-breakdown — the number that should drive your maintenance investment decisions. Most fleets discover their actual exposure is 2-3x what they had budgeted for, and that gap explains why their PM programs always feel underfunded.
Fleet Size Impact Modeling
The math compounds non-linearly with fleet size. A 10-vehicle operation experiencing average industry downtime rates absorbs roughly $40,000 in annual unplanned downtime costs. Scale that fleet to 100 vehicles and the exposure jumps past $660,000 — not 10x but closer to 16x — because larger operations carry more complex routing networks, tighter SLA terms, and higher revenue per vehicle that amplifies each downtime event.
| Fleet Size |
Avg Annual Downtime Events |
Avg Cost Per Event |
Direct Annual Exposure |
Indirect Annual Exposure |
Total Annual Cost |
| 10 vehicles |
26 events |
$1,540 |
$22,400 |
$17,600 |
$40,000 |
| 25 vehicles |
65 events |
$1,820 |
$59,200 |
$59,100 |
$118,300 |
| 50 vehicles |
130 events |
$2,180 |
$141,700 |
$141,700 |
$283,400 |
| 100 vehicles |
270 events |
$2,450 |
$330,750 |
$330,750 |
$661,500 |
| 250 vehicles |
695 events |
$2,880 |
$1,001,200 |
$1,001,200 |
$2,002,400 |
| 500 vehicles |
1,425 events |
$3,260 |
$2,322,750 |
$2,322,750 |
$4,645,500 |
Why the cost-per-event rises with fleet size
Larger fleets serve tighter SLA contracts, run higher-density routes, and operate longer working hours — meaning each breakdown disrupts more downstream commitments. The route recovery and customer penalty layers (Layers 4 and 5) scale faster than direct repair costs as operations grow.
The Reactive vs Predictive Maintenance Math
Once you've quantified your true downtime exposure, the predictive maintenance investment decision becomes obvious math rather than philosophical preference. CMMS-driven predictive maintenance programs consistently deliver 30-50% reduction in unplanned downtime, with documented fleet case studies showing 45% downtime decrease and 30% maintenance cost reduction in the first year of structured implementation.
Breakdown frequency
8.7 days unplanned downtime per vehicle annually
Average cost per event
$1,540 – $3,260 depending on fleet size
Emergency premium exposure
3-5x standard parts cost on rush shipping
Customer SLA exposure
High — events occur during operating hours
Annual cost — 50-vehicle fleet
$283,400
Breakdown frequency
3.5 – 5.5 days unplanned downtime per vehicle
Average cost per event
$650 – $1,400 (scheduled vs roadside)
Emergency premium exposure
Standard pricing — repairs scheduled in advance
Customer SLA exposure
Low — work scheduled during off-hours
Annual cost — 50-vehicle fleet
$142,000
Annual Savings From CMMS-Driven Predictive Maintenance
$141,400
Per 50-vehicle delivery fleet — combining 32% downtime reduction with 30% maintenance cost reduction documented across operator case studies. Most fleets achieve positive ROI within 6 months of full deployment.
The Hidden Cost Inputs You Probably Aren't Counting
Standard downtime calculations capture the obvious line items — repair, fuel, driver wages. But seasoned fleet operators identify another tier of costs that quietly bleed margin without ever appearing on a P&L. These are the inputs your calculator framework should include if you want an honest number.
Administrative Cascade
Dispatcher rescheduling, customer service callouts, billing adjustments, accounting reconciliation. Industry research shows administrative overhead adds 8-12% on top of direct repair costs that most fleets never separately track.
Driver Morale & Turnover
Drivers stuck waiting for repairs, juggling rerouted loads, or covering for sidelined colleagues experience higher burnout. Driver replacement costs run $7,000-$15,000 per turnover event, and breakdown frequency correlates directly with retention rates.
Compliance Risk Exposure
Skipped inspections during emergency repair pressure create DOT violation exposure. Well-maintained fleets achieve 5-15% lower insurance premiums through CSA compliance — a savings invisible until you lose it.
Asset Depreciation Acceleration
Vehicles operated past warning indicators degrade faster. A van that should last 8 years and 250K miles often retires at 6 years and 175K miles when maintenance is reactive — accelerating capital replacement cycles by 25%.
Opportunity Cost of Growth
Operations running near capacity can't accept new contracts when 8-12% of their fleet is unpredictably offline. Growth-stage operators report turning down 15-20% of available business opportunities because reliability concerns prevent commitment.
Parts Inventory Waste
Reactive operations over-stock common parts as insurance against breakdowns. Inefficient diagnostics during emergency repairs lead to unnecessary part replacements. Both behaviors add 12-18% to total parts spend versus predictive approaches.
Calculator Worksheet: Your Fleet's Annual Exposure
Use this worksheet structure to estimate your operation's actual annual downtime cost. Pull last year's maintenance records, dispatch logs, and customer SLA penalty reports. Walk through each input with conservative numbers — the result will still likely surprise you.
Fleet size (delivery vehicles)
Asset register
User-specific
Unplanned downtime days per vehicle annually
Maintenance logs
6.5 – 12.0 days
Average revenue per vehicle per day
Financial records
$1,200 – $2,800
Operating margin percentage
Financial records
3% – 8%
Fully-loaded driver hourly wage
Payroll records
$26 – $42
Average towing cost per emergency event
Repair invoices
$300 – $1,500
After-hours labor premium
Shop quotes
50% – 100% surcharge
Average SLA penalty per missed delivery
Customer contracts
$75 – $500
Stops affected per breakdown event
Dispatch records
12 – 25 stops
Overtime recovery hours per event
Payroll records
4 – 10 hours
Rental coverage cost per event
Vendor invoices
$150 – $600
Frequently Asked Questions
What's the realistic average cost of one delivery van breakdown?
Industry research consistently places total breakdown cost between $2,300 and $12,500 per event when all five cost layers are counted. Repair invoice alone misses 40-60% of actual exposure.
Oxmaint automatically tracks all five layers against every work order.
How quickly can a CMMS reduce downtime costs for a delivery fleet?
Most fleets see measurable downtime reduction within 60-90 days of structured CMMS deployment. Full ROI typically lands within 6 months. Operator case studies document 32% unplanned downtime reduction and 30% maintenance cost reduction in year one.
Why is my actual downtime cost higher than published industry averages?
Published averages ($448-$760/day) capture direct revenue loss but miss the cascade — route recovery, customer penalties, and admin overhead. Operations with tight SLAs or high-density routes routinely see real costs of $1,000-$2,000 per vehicle per day.
Book a demo to model your specific numbers.
How much should I budget for preventive maintenance vs reactive repairs?
Preventive maintenance programs cost $0.05-$0.10 per mile in structured operations, while reactive repair averages 3-9x more per event. Fleets achieving 85-95% utilization spend roughly 15-22% of total operating budget on planned maintenance versus 8-12% reactive — and end up with lower total cost.
Does fleet size change how I should calculate downtime cost?
Yes — cost per event rises non-linearly with fleet size because larger operations carry tighter SLA contracts, higher route density, and more complex coordination overhead. A 100-vehicle fleet typically sees $2,450 per event versus $1,540 for a 10-vehicle operation. The percentage savings from CMMS adoption stay consistent, but absolute dollar impact scales fast.
From calculator estimate to operational reality
Stop Estimating. Start Tracking Real Downtime Cost Per Event.
A calculator gives you a number. Oxmaint gives you the system that drives that number down — monitoring every vehicle, capturing every event, tracking every cost layer automatically. Plug in your fleet once and watch unplanned downtime drop while your maintenance ROI becomes visible to operations, finance, and leadership in a single dashboard.