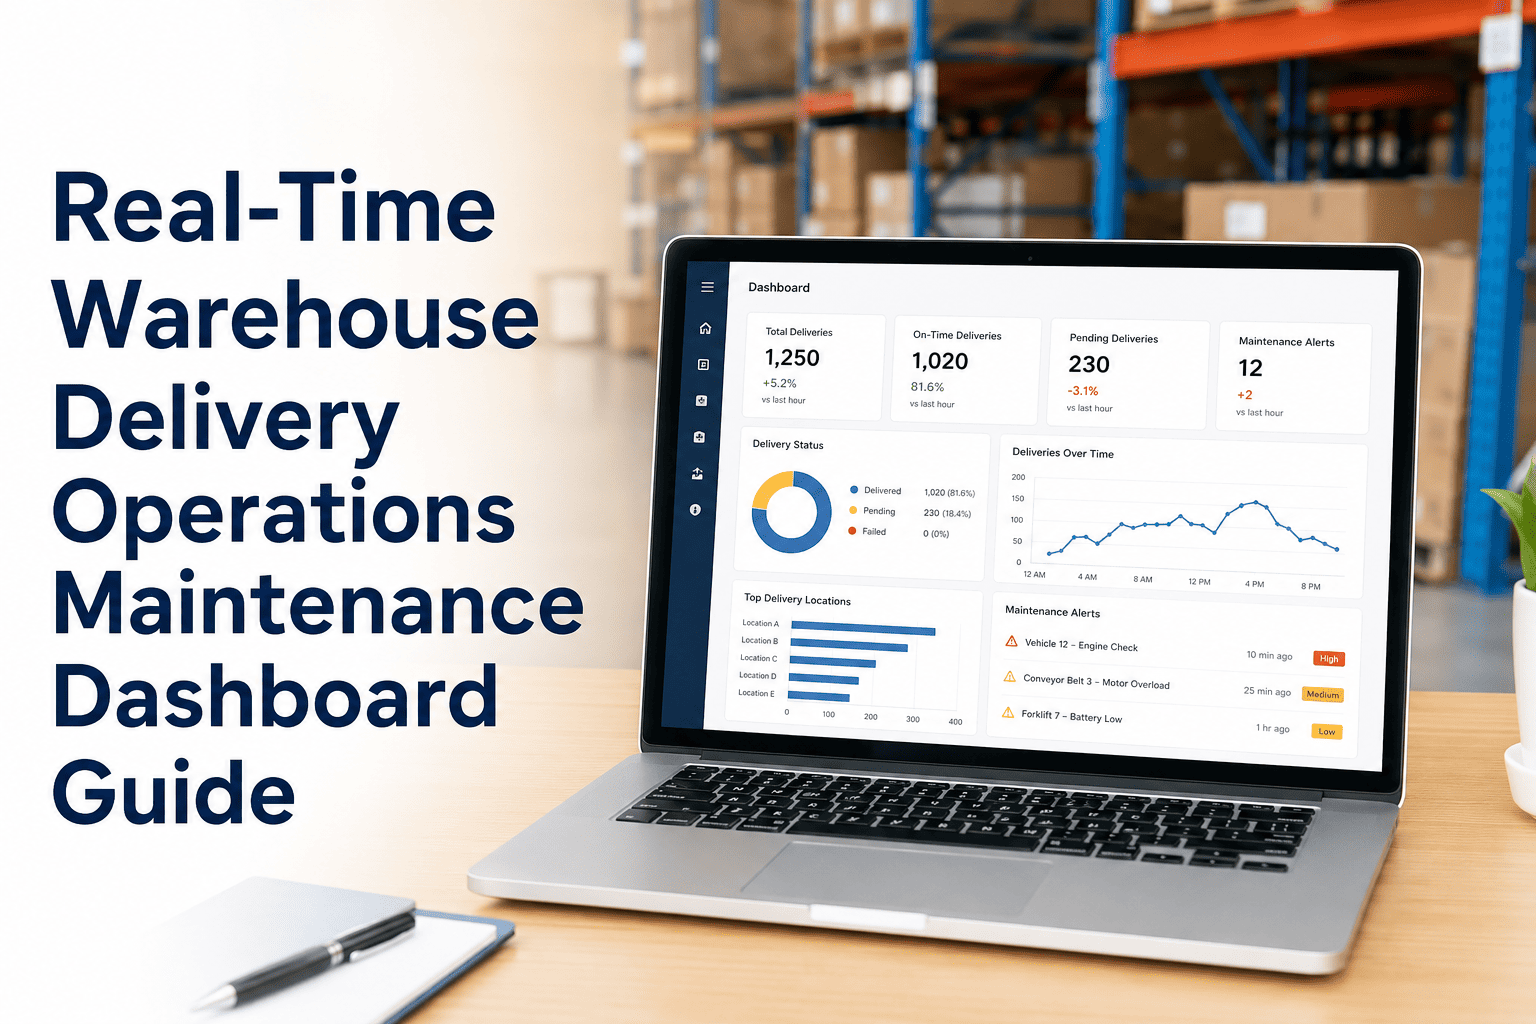
If every KPI on your warehouse maintenance dashboard is a lagging indicator, you are always one breakdown away from a missed delivery SLA. Modern CMMS platforms surface leading maintenance metrics that predict failures before they happen — giving operations managers the visibility to act before throughput is compromised, not after the damage is already logged in your incident report.
Article · Maintenance KPIs · 2026
Warehouse Delivery Operations Maintenance KPIs Every Manager Must Track
Lagging indicators tell you what broke. Leading indicators tell you what is about to. Here are the maintenance KPIs that top-performing delivery warehouse operations track — and the benchmarks that separate reactive teams from resilient ones.
68%
of warehouse operations managers cannot identify an asset at-risk until it has already failed
3.4x
higher maintenance cost per repair when failures are unplanned versus scheduled interventions
91%
fleet availability benchmark for best-in-class warehouse delivery operations with predictive CMMS
Lagging vs. Leading Maintenance KPIs — Why the Difference Matters
Most maintenance dashboards are full of lagging KPIs — MTTR, breakdown counts, cost per repair. These metrics are valuable for post-analysis but useless for preventing the next failure. Operations managers need both layers to run a proactive maintenance programme.
Lagging Indicators
Measure what already happened
Mean Time to Repair (MTTR)
Unplanned downtime hours per month
Breakdown frequency per asset
Emergency maintenance spend
Parts cost per incident
Use lagging KPIs to track trends and benchmark progress — not to prevent the next failure.
Leading Indicators
Predict what is about to happen
Planned Maintenance Compliance (PMC)
Predictive work orders actioned on time
Open work order age by asset criticality
Asset health score trend per unit
Parts stockout rate before scheduled PM
Leading KPIs are the early warning system — they tell you where the next failure is building before it happens.
The 10 Core Maintenance KPIs for Warehouse Delivery Operations
These are the metrics that separate reactive maintenance programmes from operations that consistently hit delivery SLAs without unplanned downtime events.
Leading
Planned Maintenance Compliance (PMC)
PM tasks completed on time ÷ PM tasks scheduled × 100
Target: 95%+
The single most predictive KPI for unplanned downtime. Warehouses with PMC above 95% report 60–70% fewer emergency breakdowns. If PMC is below 85%, your maintenance backlog is building failure risk invisibly.
Leading
Predictive Work Order Closure Rate
Predictive WOs closed within SLA ÷ Total predictive WOs raised × 100
Target: 90%+
Measures whether AI-generated maintenance alerts are being acted on before they become failures. A low rate means the prediction engine is working but execution is the bottleneck — usually a scheduling or parts availability issue.
Lagging
Mean Time Between Failures (MTBF)
Total operational hours ÷ Number of failures in period
Target: Increasing trend quarter over quarter
MTBF rising over time confirms your preventive programme is working. Flat or declining MTBF despite scheduled maintenance signals that the PM intervals or inspection depth need adjustment based on actual asset behaviour.
Lagging
Mean Time to Repair (MTTR)
Total repair time ÷ Number of repair events
Target: Below 2 hours for critical path assets
High MTTR exposes gaps in technician skills, parts availability, or diagnostic speed. CMMS guided repair workflows and instant access to asset history typically reduce MTTR by 30–45% in the first year of deployment.
Leading
Maintenance Backlog Ratio
Open work orders ÷ Average weekly WO completion capacity
Target: Below 2 weeks backlog
A backlog above 2 weeks means deferred maintenance is accumulating faster than it can be addressed. This is the clearest early warning signal of an operation approaching a wave of simultaneous breakdowns — especially in high-utilisation delivery peaks.
Lagging
Overall Equipment Effectiveness (OEE)
Availability × Performance × Quality
Target: 85%+ for automated warehouse assets
OEE captures the full picture of asset productivity — not just whether it ran, but how well. Conveyors, sorters, and AGVs with OEE below 75% are costing throughput even when they show no breakdown events in the log.
Leading
Asset Health Score Distribution
% of fleet assets in Good / Warning / Critical health bands
Target: Less than 10% of fleet in Warning or Critical
A real-time fleet health distribution gives operations managers an instant read on systemic risk. More than 15% of assets in Warning band typically precedes a spike in breakdown events within 30 days — the signal to increase maintenance resource deployment before delivery peaks.
Lagging
Emergency vs. Planned Maintenance Ratio
Emergency maintenance hours ÷ Total maintenance hours × 100
Target: Below 15% emergency
World-class maintenance operations run at under 10% emergency ratio. Above 30% indicates a reactive culture where the maintenance team is constantly firefighting rather than preventing. This ratio is also directly correlated with total maintenance cost per asset.
Leading
Parts Availability at Work Order Initiation
WOs with all parts available at start ÷ Total WOs × 100
Target: 95%+
Every work order that starts without the required parts extends repair time and ties up a technician. Below 80% parts availability at WO initiation signals that inventory forecasting is disconnected from the maintenance schedule — a common gap in manual systems.
Lagging
Maintenance Cost as % of Replacement Asset Value (RAV)
Annual maintenance cost ÷ Asset replacement value × 100
Target: 2–4% RAV for warehouse equipment
Spending above 6% RAV on a single asset year-over-year is typically a signal that repair costs are approaching the economic argument for replacement. CMMS lifecycle cost reporting makes this calculation automatic and flags assets approaching the replace decision threshold.
See All 10 KPIs on One Live Dashboard
Oxmaint CMMS tracks leading and lagging maintenance KPIs in real time — giving operations managers the visibility to act before failures happen, not after delivery SLAs are missed.
KPI Benchmarks by Warehouse Operation Type
Not all warehouse operations face the same asset intensity. Use these benchmarks to calibrate your targets against operations of similar complexity.
Building a Maintenance KPI Dashboard That Actually Gets Used
A KPI dashboard fails when it shows too much and drives no action. The most effective maintenance dashboards are built around three decision layers — each with a different audience and review cadence.
Asset health scores — current fleet status in Good / Warning / Critical
Open work orders due today and overdue by criticality
Predictive alerts actioned in last 24 hours
Parts availability for scheduled maintenance today
PMC rate — planned tasks completed vs. scheduled this week
Predictive work order closure rate and average age
Emergency vs. planned maintenance ratio trending
Maintenance backlog ratio by asset class
MTBF and MTTR trends against prior quarter and benchmark
OEE per asset class and fleet average
Maintenance cost as % RAV — fleet-wide and by asset type
Capital planning signals — assets approaching replacement threshold
Frequently Asked Questions
Stop Managing Maintenance by Gut Feel — Track the KPIs That Prevent Failures
Oxmaint CMMS automatically calculates every leading and lagging maintenance KPI from live work order and asset health data — giving warehouse delivery operations managers real-time visibility without manual reporting overhead.