Private universities face a defining challenge. With Moody's estimating that higher education institutions need between $750 billion and $950 billion over the next decade to address aging infrastructure, and the average campus building now approaching 50 years old, facilities leaders must transform how they approach capital planning. The traditional method of waiting for systems to fail before requesting budget allocations is no longer sustainable. Today's competitive enrollment landscape demands that private institutions demonstrate fiscal responsibility while maintaining facilities that attract students, faculty, and donors. This handbook provides a systematic framework for using asset health data to drive smarter capital decisions, reduce emergency spending, and extend the productive life of your campus infrastructure.
Hero Stats SectionUnderstanding the Facility Condition Index Framework
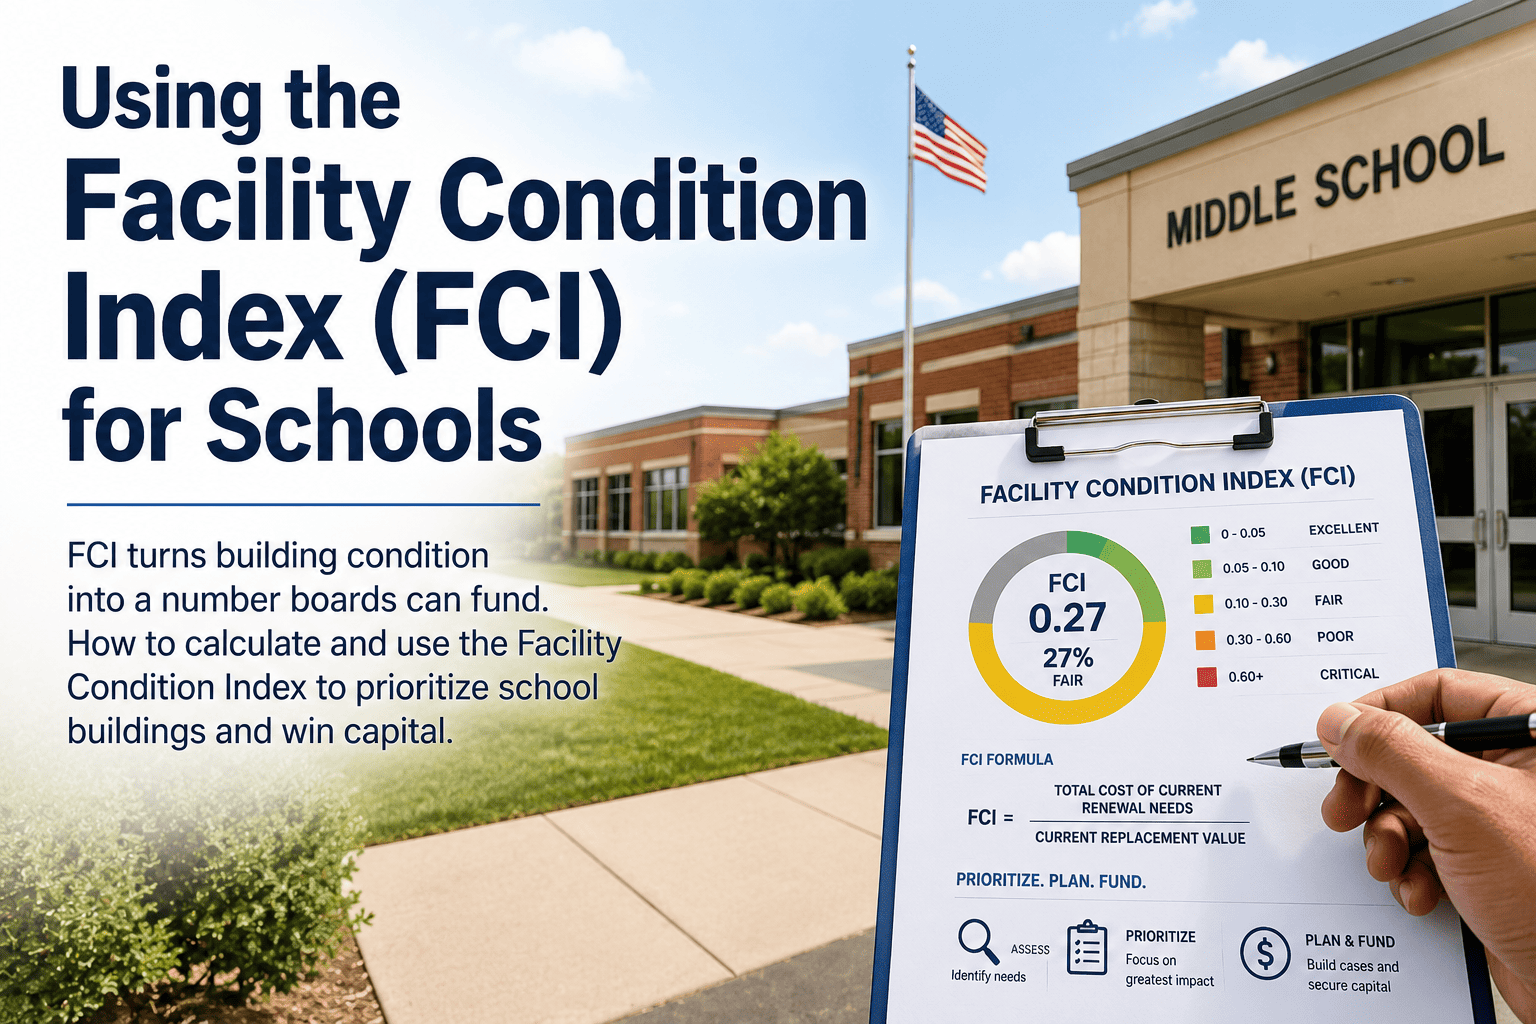
The Facility Condition Index represents the cornerstone metric for data-driven capital planning. First published in 1991 by the National Association of College and University Business Officers, FCI provides an objective, universally accepted benchmark that transforms subjective building assessments into actionable financial data. The formula divides the cost of deferred maintenance and repairs by the current replacement value of the facility, yielding a percentage that indicates overall condition.
FCI Scale VisualUniversities that target an FCI below 10% across their portfolio demonstrate proactive stewardship. When FCI climbs above 15%, facilities teams spend disproportionate time responding to emergencies rather than executing planned maintenance. The University of British Columbia's 2023 assessment revealed their overall FCI in the "high orange zone" indicating excessive reactive spending. Their subsequent focus on minor capital projects for high-FCI buildings while maintaining strategic operations for better-performing assets illustrates the balanced approach required.
Asset Lifecycle Intelligence: The Foundation of Capital Forecasting
Every campus building contains dozens of systems with distinct replacement cycles. HVAC equipment typically requires major renewal after 15-25 years. Roofing systems demand replacement every 20-25 years. Electrical infrastructure may last 30-40 years under proper maintenance. Without systematic tracking of installation dates, maintenance history, and condition assessments, facilities teams cannot accurately forecast when capital investments will be required. This creates the reactive cycle that drives costs upward and erodes institutional confidence in facilities management.
Asset Lifecycle Table| Asset Category | Expected Life | Key Failure Indicators | Capital Impact |
|---|---|---|---|
| HVAC - Chillers | 20-25 years | Efficiency loss >15%, increased repairs | High ($500K-$2M+) |
| HVAC - Air Handlers | 20-30 years | Motor failures, coil degradation | Medium ($50K-$200K) |
| Roofing - Commercial | 20-25 years | Ponding, membrane cracks, leaks | High ($15-25/sq ft) |
| Boilers - Steam | 20-30 years | Tube failures, efficiency decline | High ($200K-$1M) |
| Electrical - Switchgear | 30-40 years | Insulation breakdown, arc flash risk | High ($100K-$500K) |
| Elevators | 20-25 years | Control system obsolescence | High ($150K-$400K) |
| Plumbing - Distribution | 40-50 years | Corrosion, pressure loss, leaks | Medium-High (varies) |
| Windows - Commercial | 25-40 years | Seal failures, condensation | Medium ($300-600/window) |
An APPA report documents that work orders in buildings 25 to 50 years old average $2.35 per square foot versus $1.40 for buildings under 10 years of age. This 68% cost differential compounds across multi-million-square-foot portfolios, making lifecycle-based planning essential for budget predictability. Start your asset tracking transformation today: Create Your Free Oxmaint Account
Building the Asset Health Data Infrastructure
Transforming capital planning from intuition to data requires systematic information capture across every touchpoint. Less than 10% of higher education institutions fully leverage their CMMS for capital planning, according to facilities leadership at the University of Chicago. This represents an enormous opportunity for private universities willing to invest in data infrastructure. The corrective maintenance tasks your team completes daily contain invaluable signals about which assets approach failure thresholds.
Data PyramidEach level builds upon the foundation below it. Without accurate asset registry data, maintenance history lacks context. Without maintenance history, condition monitoring data cannot be correlated with failure patterns. The University of Chicago processes approximately 70,000 corrective maintenance tasks annually. Each task represents a data point that, when properly captured, informs lifecycle predictions and capital timing decisions.
CTA Section 1The Five-Phase Capital Planning Workflow
Effective capital planning follows a structured cycle that continuously refines priorities based on emerging asset health data. This workflow replaces the traditional annual budget request scramble with a systematic process that builds institutional confidence and improves funding success rates. Universities implementing this framework report stronger relationships with CFOs and boards because capital requests come supported by defensible data rather than departmental advocacy.
Workflow ProcessIoT and Predictive Analytics: The Competitive Edge
Forward-thinking universities are deploying Internet of Things sensors to capture real-time asset performance data. Research from the University of Zaragoza demonstrates that IoT-based HVAC monitoring can reduce energy consumption by 40-70% through occupancy-based controls and early anomaly detection. The University of Pisa achieved 34% energy savings using low-cost environmental sensors networked across campus buildings. These technologies deliver dual benefits: immediate operational savings and rich data streams that enhance capital forecasting accuracy.
IoT Benefits GridPredictive maintenance delivers cost reductions of 8-12% compared to preventive maintenance alone, and up to 40% compared to reactive maintenance strategies. The American Society of Mechanical Engineers found average ROI for predictive maintenance projects reaches 250%. McKinsey research shows leading organizations achieve 10:1 to 30:1 ROI ratios within 12-18 months of implementation. For private universities operating on tuition-dependent budgets, these economics are transformative. Explore how IoT integration can enhance your campus operations: Book a Technical Consultation
Compliance and Risk Documentation
Capital planning cannot exist in isolation from regulatory compliance. Fire alarm systems, emergency lighting, elevator inspections, and accessibility requirements all carry both legal obligations and capital implications. A comprehensive CMMS captures inspection schedules, compliance documentation, and corrective action records in a single audit-ready system. This integration ensures that compliance-driven capital needs receive appropriate prioritization and that documentation exists to demonstrate institutional diligence.
Compliance MatrixExpert Review: The Strategic Imperative
The convergence of demographic pressures, deferred maintenance backlogs, and enrollment competition has elevated facilities management from operational function to strategic imperative. Moody's explicitly warns that colleges unable to offer updated facilities risk losing competitive position in enrollment markets. The organization notes that deferred maintenance could lead to higher costs if infrastructure deteriorates to critical levels, citing the University of New Mexico where a waterline break cascaded into $100,000 in repairs plus substantial labor hours and productivity losses.
Private institutions face particular urgency. Without state funding to subsidize infrastructure investments, they must demonstrate exceptional stewardship to attract tuition revenue and donor support. The facilities arms race that drove campus construction for decades has given way to a facilities sustainability challenge. Institutions that master asset health intelligence will make better investment decisions, reduce emergency disruptions, and present more compelling cases to stakeholders. Those that continue reactive approaches will see their competitive position erode alongside their physical infrastructure.
The path forward requires investment in both technology and process. CMMS platforms provide the data infrastructure. Facility condition assessments provide the baseline. Predictive analytics provide the forecasting capability. But the transformation ultimately depends on institutional commitment to treating facilities data as a strategic asset worthy of executive attention and board-level oversight.
Implementation Roadmap
Transforming capital planning capabilities requires phased implementation that builds organizational competency while delivering early wins. Attempting to deploy comprehensive predictive analytics before establishing reliable asset registries creates frustration without results. The following roadmap provides realistic timeframes for private universities beginning their journey toward data-driven capital planning. Ready to benchmark your current state? Access the Oxmaint Assessment Tools
Implementation TimelineConclusion
Private universities operate at a critical juncture. The $36.2 billion deferred maintenance backlog facing private institutions will not resolve itself through traditional reactive approaches. Competition for students intensifies while the average campus building ages beyond its designed service life. Facilities leaders who establish asset health intelligence capabilities position their institutions to make smarter capital investments, reduce costly emergencies, and demonstrate the fiscal responsibility that attracts students, faculty, and donors.
The technology exists. CMMS platforms, IoT sensors, and predictive analytics have matured to the point where implementation barriers are primarily organizational rather than technical. The methodology is proven. Facility Condition Index frameworks and lifecycle cost analysis have guided institutional decision-making for over three decades. What remains is institutional commitment to treating asset health data as a strategic resource and capital planning as a continuous process rather than an annual budget exercise.
Begin with accurate asset inventories. Progress to systematic condition assessments. Build toward predictive intelligence. Each step reduces risk, improves budget predictability, and strengthens your institution's competitive position. The universities that thrive over the coming decade will be those that transform their facilities from liabilities into strategic assets. Your capital planning transformation can start today: Launch Your Oxmaint Platform
FAQ Section