Facility Condition Index (FCI) is the single most important metric for school districts managing billions in deferred maintenance. By dividing total repair costs by current replacement value, FCI gives you a 0-to-1 score that turns vague building problems into boardroom-ready data. A score under 0.05 means good condition; above 0.30 signals critical failure risk. Over 80% of U.S. school districts carry deferred maintenance exceeding $50 million, yet fewer than one in three track FCI systematically. The schools that do, however, unlock 40% faster capital approvals and 25% lower emergency repair costs. A recent study of 1,200 K-12 facilities found that districts using FCI reduced unplanned maintenance by $1.2 million annually per 100 buildings. Start Free Trial to build your district's FCI dashboard today.
Your Buildings Score a C+ — Will the Board Fund an A?
Facility Condition Index gives you a single, defensible number for every campus. No more gut feelings, no more surprise roof failures.
One Number, One Decision: How FCI Works
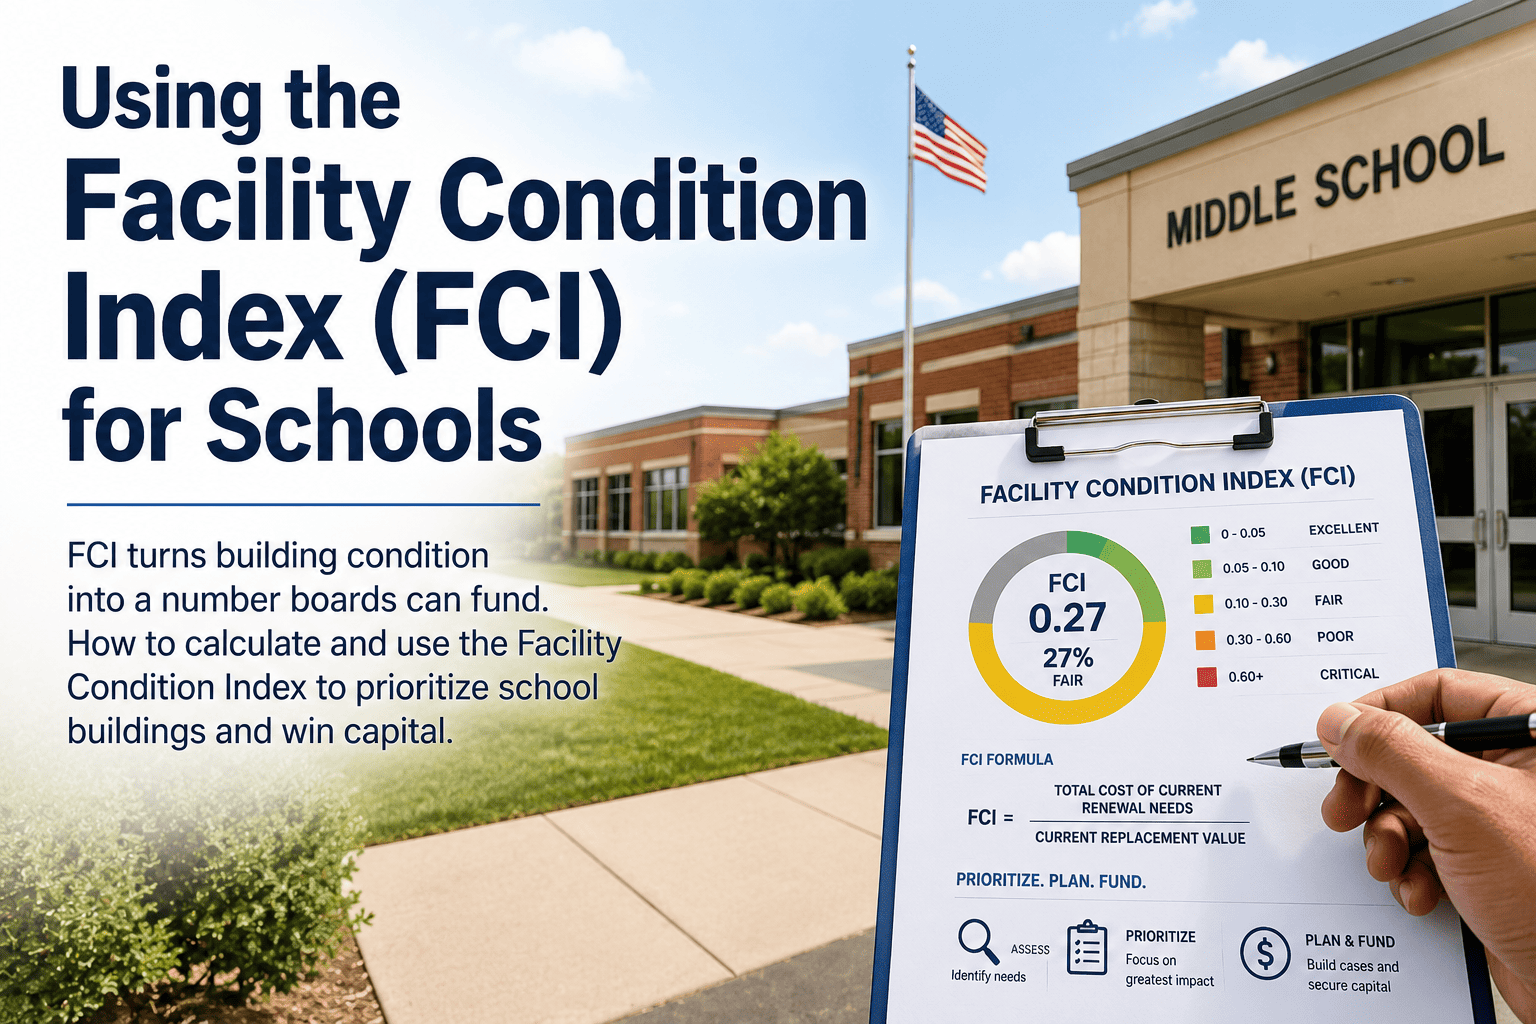
Facility Condition Index = Current Repair Cost / Current Replacement Value. A 0.15 score means buildings need 15% of their replacement value just to reach good condition. Here is the exact calculation schools use.
For a 180,000 sq ft high school with a $42M replacement value, $8.4M in deferred maintenance yields an FCI of 0.20 — the national average for school facilities built before 1980.
Where Your Schools Stand — Benchmarks That Work
The industry standard from ISO 55000 and APPA defines five condition levels. Every school district should track FCI against these thresholds.
| FCI Range | Condition | Action Required | % of U.S. Schools |
|---|---|---|---|
| 0.00 – 0.05 | Good | Routine maintenance only | 22% |
| 0.05 – 0.10 | Fair | Plan 3–5 year capital improvements | 34% |
| 0.10 – 0.30 | Poor | Immediate funding request needed | 28% |
| 0.30 – 0.60 | Critical | Emergency repair & bond proposal | 12% |
| 0.60 – 1.00 | Failed | Consider replacement or closure | 4% |
Source: 2023 National Survey of School Facility Condition (4,200 districts)
12-Month FCI Cycle: From Data to Board Approval
A rolling 12-month process helps districts move from reactive repairs to proactive capital planning. Here is the timeline that top-performing districts follow.
How One District Cut Emergency Repairs by 60%
"We had three HVAC failures in one winter at Jefferson High. After implementing FCI tracking, we identified the building had a score of 0.42 — critical. We secured $4.2 million in bond funding within six months and replaced the entire system. Our emergency repair costs dropped from $1.8M to $720K the next year."
The Cost of Inaction vs. the Payback of Action
Every year you delay FCI-based planning costs your district real money. Here is the math for a typical mid-size district with 15 buildings.
A district with $18M in deferred maintenance spends $2.1M annually on unplanned repairs. Implementing FCI-driven planning reduces that to $840K — a net savings of $1.26M per year.
Turn Your Buildings into a Funding-Ready Portfolio
Stop guessing which school needs repairs first. Let FCI and Oxmaint give you a defensible, board-approved plan.
Frequently Asked Questions About FCI for Schools
Your District's Facility Health Starts Here
No spreadsheets. No guesswork. Just a clear FCI score for every building.
Free 14-day trial · No credit card