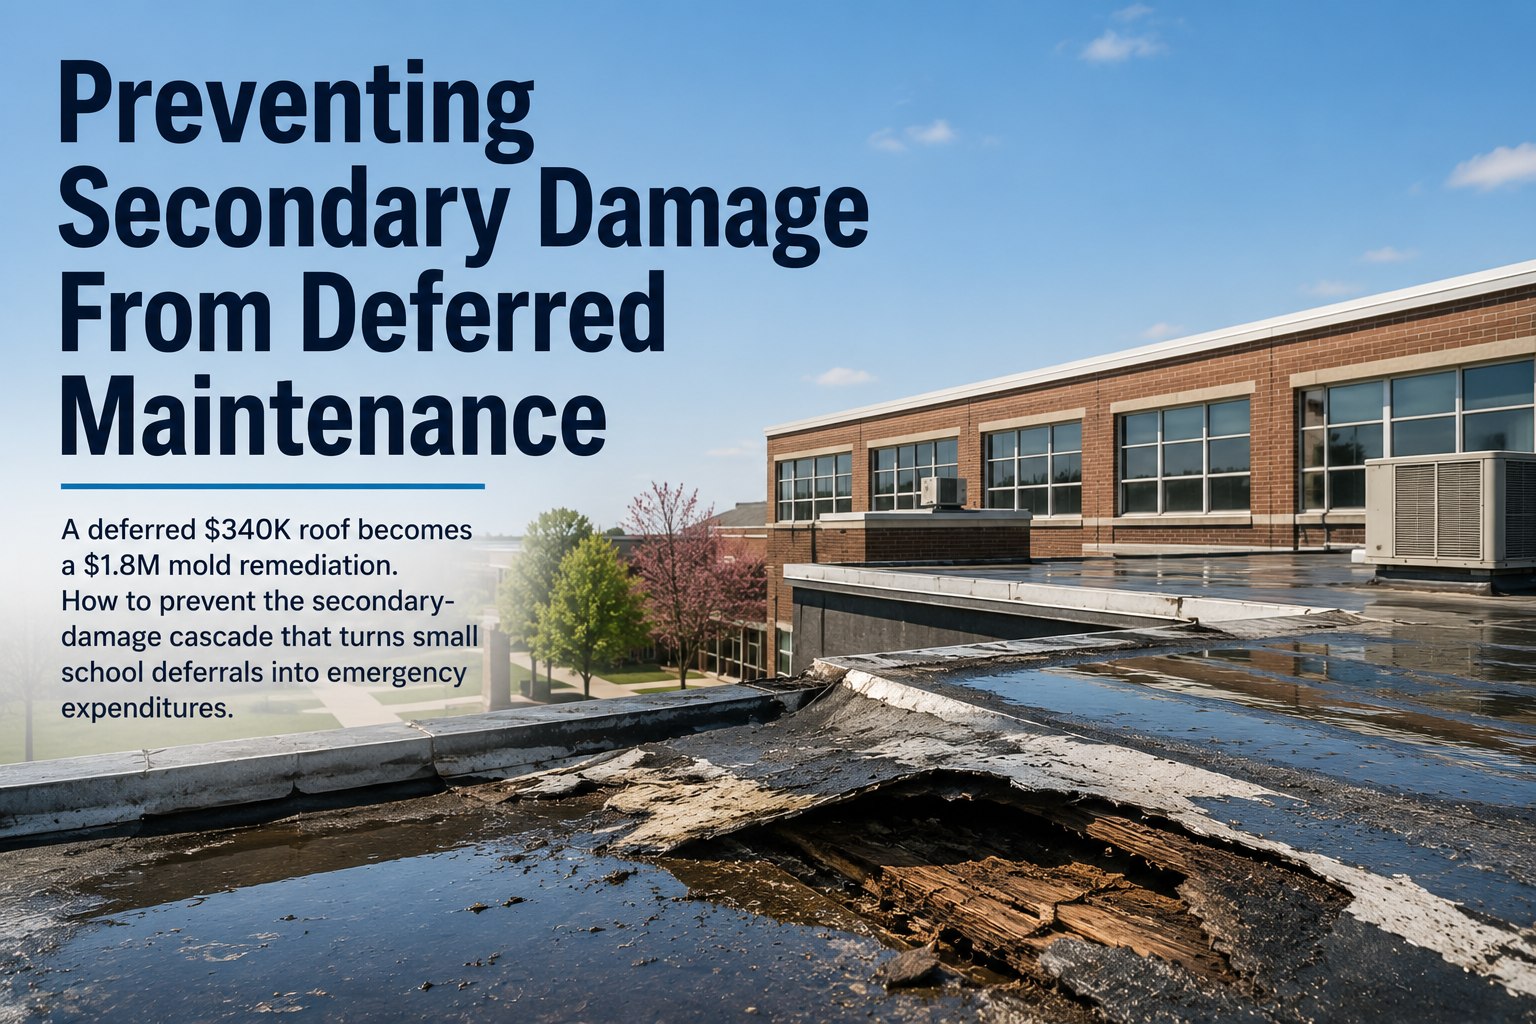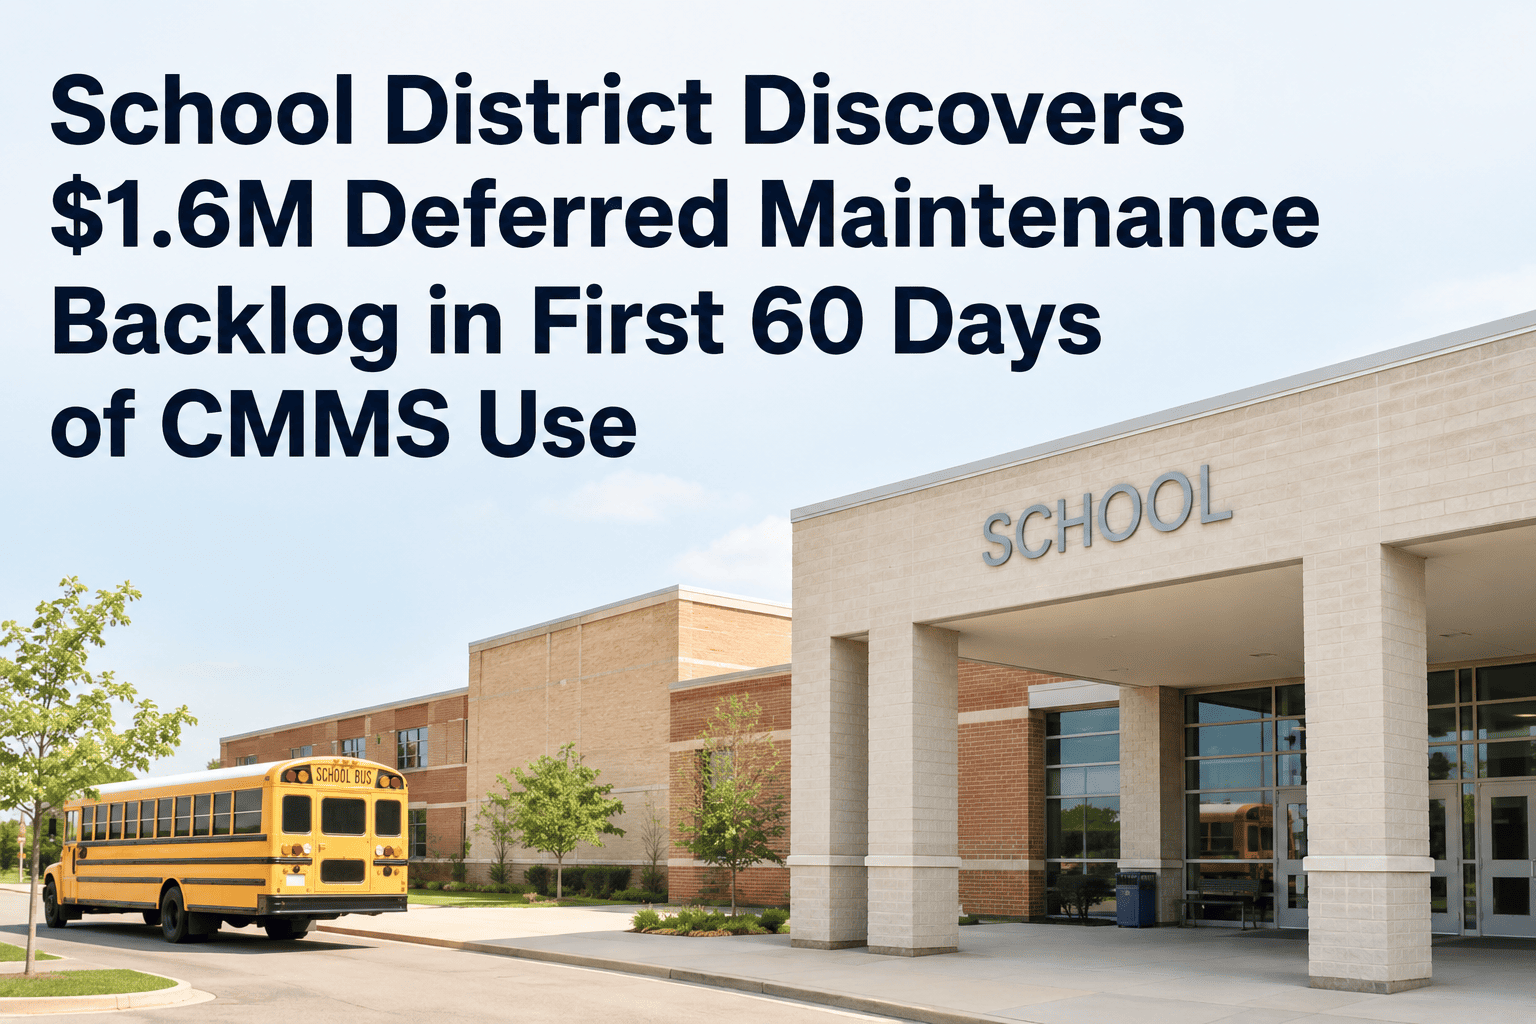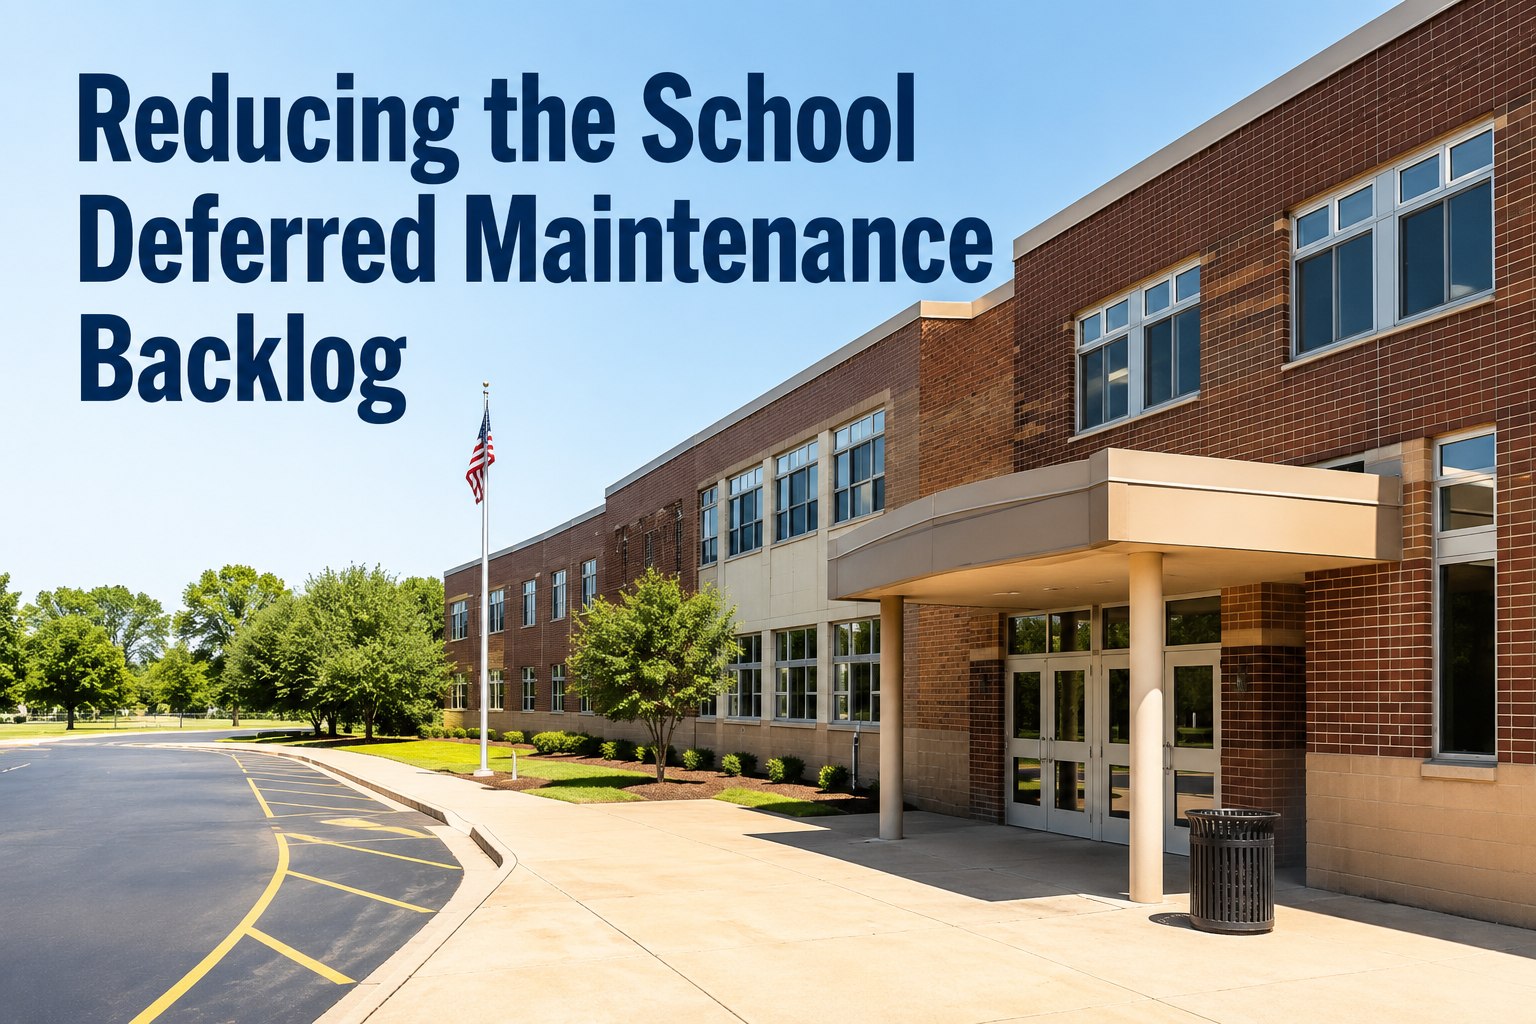
By fiscal year 2025, U.S. K–12 school districts collectively face a deferred maintenance backlog estimated at $515 billion, with each year of delay adding 6–8% compound interest to repair costs while facility budgets grow just 2–3% annually. Without a strategic intervention, a single roof replacement that costs $150,000 today may balloon to $270,000 in seven years. The solution lies in a data-driven, tiered prioritization framework that aligns with ISO 55000 asset management standards. Oxmaint's facility maintenance software helps school district leaders measure, rank, and systematically reduce this backlog. Start Free Trial today to transform your deferred maintenance burden into a manageable, budgetable program.
Why Deferred Maintenance Compounds Faster Than Budgets
Each year, the deferred maintenance backlog grows at a compound rate of 6–8%, driven by inflation, escalating material costs, and asset deterioration. Meanwhile, average school facility budgets increase only 2–3% annually. For a district with a $42 million backlog, this means the gap widens by $1.7 million to $2.5 million per year even before any new repairs are funded.
Three Pillars of Backlog Reduction
Successful school districts that have cut their backlog by 25–40% over three years follow this proven framework based on ISO 55000 asset management principles.
Measure & Classify
Conduct a comprehensive facility audit using a standardized 1–5 condition index. In a typical 200-building district, 15% of assets (the worst 60 buildings) account for 80% of the deferred maintenance cost. Classify each item as critical (life safety), major (structural), or minor (cosmetic).
Prioritize by Risk
Assign a risk score using the formula: Risk = Condition Index x Safety/Compliance Weight x Occupancy Impact. Emergency repairs (roof leaks, HVAC failures) get a weight of 10, while deferred painting scores 1. This ensures limited budgets address the highest-risk assets first.
Fund & Execute
Dedicate 70% of the annual repair budget to top-tier items (risk score 8–10), 20% to mid-tier (score 4–7), and 10% to low-tier. Track actual spend vs. planned. Districts using this method have reduced their Tier 1 backlog by 35% annually while keeping new deferrals below 5% of total asset value.
The Compounding Cost of Delay
Consider a real-world scenario: A 180-building district with a $12.6 million deferred maintenance backlog. They allocate $1.2 million annually to repairs. Without a prioritization strategy, the backlog grows at 7% per year. With the 70/20/10 approach, they can reduce it by $800,000 annually in the first year alone.
| Year | Backlog (No Strategy) | Backlog (With Strategy) | Reduction |
|---|---|---|---|
| 1 | $12.6M | $12.6M | $0 |
| 2 | $12.9M | $11.8M | $1.1M |
| 3 | $13.3M | $10.9M | $2.4M |
| 4 | $13.8M | $9.8M | $4.0M |
| 5 | $14.3M | $8.9M | $5.4M |
Measure What Matters: Backlog Reduction KPIs
Track these five metrics monthly to ensure your backlog reduction program stays on course and demonstrates value to school boards and taxpayers.
12-Month Backlog Reduction Roadmap
A phased approach that delivers measurable results within the first fiscal year, aligned with typical school district budgeting cycles.
What District Leaders Say
"Our district had a $23 million deferred maintenance backlog growing at $1.8 million per year. With Oxmaint, we prioritized and tracked every repair. In 18 months we cut the backlog by 28% and saved $2.1 million in avoided emergency repairs. The board finally sees the data behind every dollar."
Start Reducing Your Backlog Today
Gain visibility into every asset, prioritize repairs, and demonstrate measurable progress to your school board.
Frequently Asked Questions
Take Control of Your School's Deferred Maintenance
Reduce the backlog, protect student safety, and optimize every facility dollar.