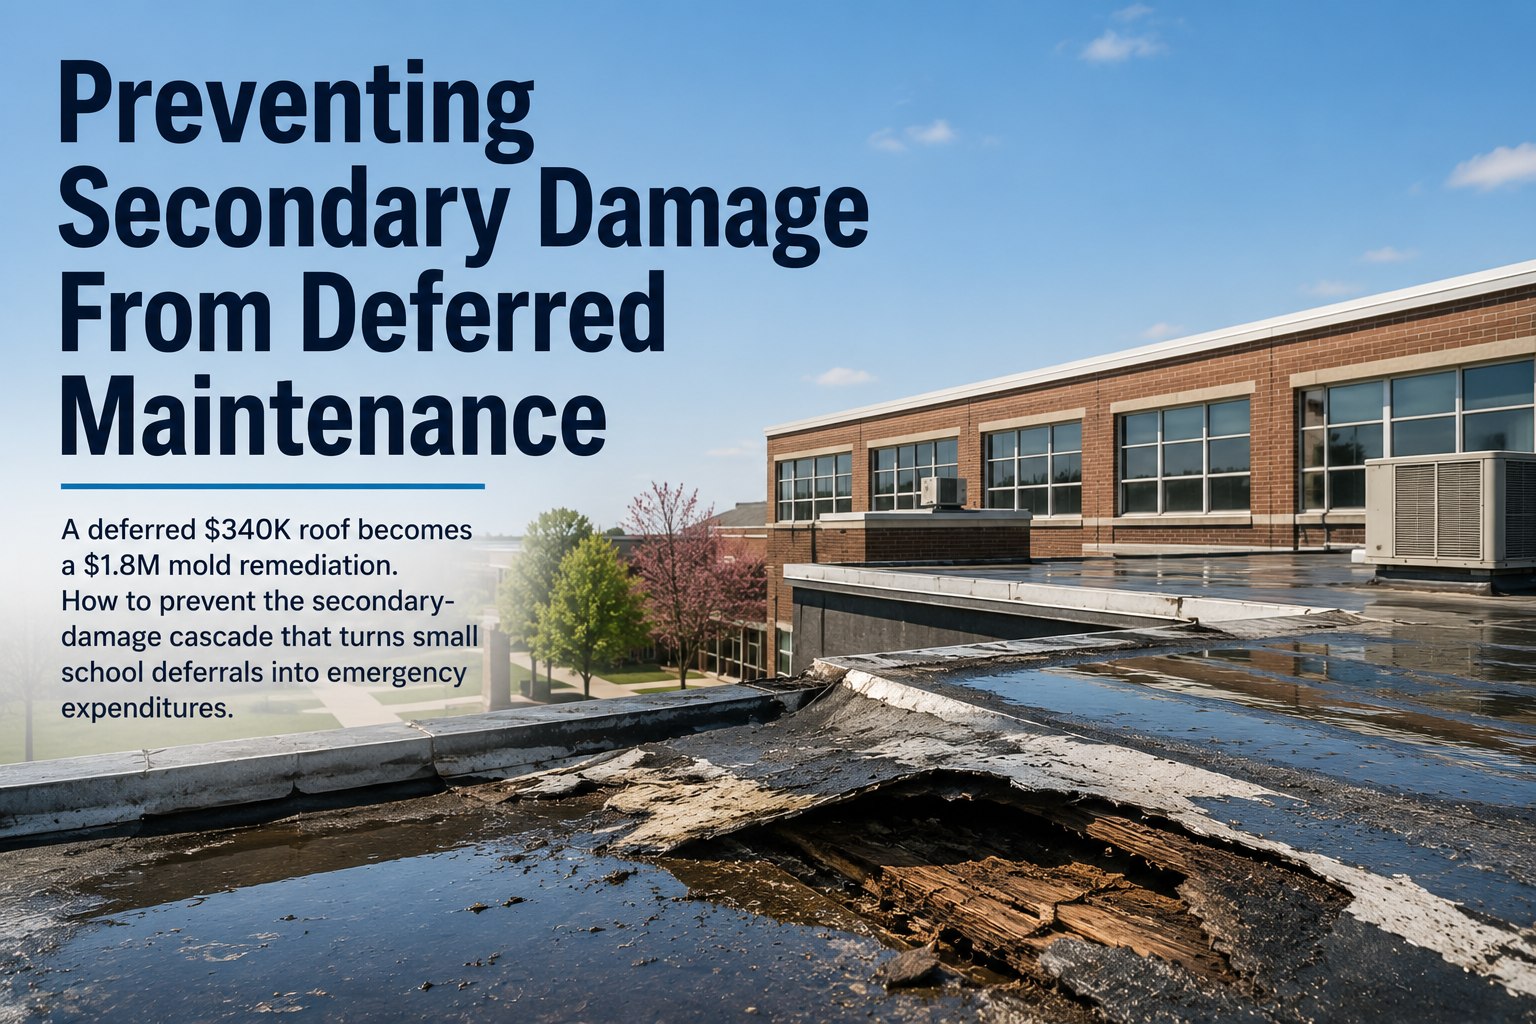
Deferred maintenance rarely stays deferred forever — it compounds. A $340,000 roof re-cover that a facilities director postpones for two budget cycles becomes, after one winter of saturated insulation, a $1.8 million mold remediation, ceiling replacement, and temporary-classroom bill. School districts across North America now carry an average deferred-maintenance backlog of $50 per square foot, and the secondary-damage cascade — water intrusion, biological growth, electrical faults, structural decay — is where those numbers silently double. The good news is that cascading failure is predictable, measurable, and preventable with a disciplined triage process and a CMMS that flags high-consequence deferrals before they multiply. If you want to stop trading minor repairs for emergency expenditures, Start Free Trial and put that triage on autopilot.
One deferred roof repair. A $1.8M cleanup bill.
When a school postpones a $340K roof re-cover, water intrusion does not wait for the next budget cycle — it triggers mold, ceiling collapse, and emergency remediation that costs 5× the original fix. Stopping the cascade starts with knowing which deferrals actually matter.
Why a small deferral becomes a six-figure emergency
Secondary damage is the failure that follows the first failure. A roof membrane cracks, water enters the envelope, insulation loses R-value, ceiling tiles sag, drywall paper feeds mold, and a single event becomes a building-wide remediation. The cascade is not random — it follows four predictable stages.
Primary Failure
A deferred component fails on its own terms — a roof seam opens, a backflow valve seizes, a boiler tube thins beyond tolerance. Average age at failure: 23 years on assets rated for 30.
Hidden Migration
Water, heat, or current travels inside the envelope for 30–90 days before any visible symptom appears. By the time a stain shows on a ceiling tile, insulation above is already saturated.
Biological & Structural Growth
Mold colonies establish within 48 hours of moisture contact on paper-faced drywall. Concurrently, fasteners corrode and load paths weaken — turning a cosmetic issue into a life-safety one.
Emergency Exposure
A ceiling collapses, a breaker arcs, a pipe bursts. The district pays emergency rates (2.3× standard labor), relocates students, and remediates damage that was preventable for 19% of the final cost.
A 220,000 sq ft middle school, three deferrals, one cascade
Year 1 — Roof assessment flags membrane blisters across 14,000 sq ft. Estimated re-cover: $340K. Bond cycle postponed; work rescheduled to Year 3.
Year 2 — A January ice dam forces water under the membrane. Custodial staff patch ceiling tiles monthly. No moisture mapping is performed.
Year 3 — A classroom ceiling collapses over winter break. Aspergillus remediation, drywall replacement, temporary classrooms, and emergency roof replacement total $1.8M — a 5.3× cost multiplier on the original deferral.
The deferred items most likely to cascade
Not every deferral is equal. A scratched floor tile can wait; a failed roof flashing cannot. These six asset classes account for roughly 78% of secondary-damage claims in K–12 and higher-education facilities.
| Deferred asset | Typical primary fix | Secondary damage if deferred | Cascade cost multiplier | Time-to-cascade |
|---|---|---|---|---|
| Roof membrane & flashing | $8–$14 / sq ft re-cover | Mold, insulation loss, ceiling collapse, electrical shorts | 4.5–6× | 1 season |
| Backflow preventer / pressure valve | $1,200–$3,000 service | Catastrophic flood, slab damage, content loss | 30–60× | Anytime |
| Boiler tubes & refractory | $8K–$22K retube | Carbon monoxide, freeze burst, building closure | 8–12× | 1 heating season |
| Window & door sealants | $4–$9 / linear ft reseal | Water intrusion, pest entry, mold in wall cavity | 5–7× | 2–3 seasons |
| Electrical panel breakers (age 25+) | $600–$1,800 replacement | Arc flash, fire, smoke damage, full panel upgrade | 10–15× | Anytime |
| HVAC condensate drains & pans | $300–$800 cleanout | Ceiling saturation, biological growth, drywall failure | 6–9× | 1 cooling season |
A deferral-risk formula that prioritizes what actually matters
Most districts rank deferred work by asset age or complaint volume — neither predicts cascade potential. A deferral-risk score combines three measurable inputs so facilities directors can defend their funding requests with numbers, not anecdotes.
DRS > 40
Catastrophic cascade probable within one season. Pull from reserve fund, declare emergency, or fast-track capital. Examples: failed roof flashing, seized backflow valve, arcing panel.
DRS 15–40
Significant secondary risk within 12 months. Schedule into the next capital cycle, fund from maintenance reserves, and add interim inspections every 60 days.
DRS < 15
Low cascade potential. Manage through the standard PM cycle and revisit scoring annually or when conditions change. Examples: floor tile, paint, fencing.
How a CMMS stops the cascade before it starts
A computerized maintenance management system (CMMS) turns deferral-risk scoring from a spreadsheet exercise into an automated defense layer. OXMAINT customers using risk-based work ordering report a 60% reduction in emergency repair spend within the first year.
Asset registry with condition scoring
Every asset carries a live condition score (0–100) updated by inspection data, age, and failure history. Assets dropping below 40 trigger automatic Tier 1 review — no manual reporting required.
Time-window alerts
When a deferral enters its cascade window — say, a roof 30 days before freeze-thaw season — the CMMS escalates an alert to the director and the business office, with the projected cost of inaction attached.
Cost-of-deferral reporting
Every deferred work order shows two numbers side by side: the cost to fix today, and the projected cost to fix after cascade. That single comparison converts a facilities conversation into a finance conversation.
Inspection-driven rescoring
Mobile inspections feed condition data back into the DRS formula in real time. A roof that scored 22 in August can climb to 47 by October if the inspector logs new blisters — and the work order reprioritizes automatically.
We stopped arguing about which deferred repair to fund first. The CMMS shows us the cascade cost in dollars, and the school board funds the top three without debate. Our emergency repair budget dropped 58% in 14 months.
Stop trading $340K repairs for $1.8M disasters.
Deploy a deferral-risk scoring system across your entire asset registry in under a week. See your cascade-exposed assets before the next budget meeting.
Preventing secondary damage: what facility leaders ask
How quickly does secondary damage develop after a primary failure?
Water-borne damage is the fastest cascade — mold colonies establish on paper-faced drywall within 48 hours of moisture contact, and hidden saturation inside wall cavities can take 30–90 days to show visible symptoms. Electrical and mechanical cascades (arc flash, freeze burst) can trigger instantaneously. The window between primary failure and secondary damage is measured in days, not budget cycles, which is why time-window alerts in a CMMS are critical.
What is the single highest-risk deferred asset in a school building?
Roof membrane and flashing consistently rank first, accounting for the largest cascade multipliers (4.5–6×) and the highest frequency of secondary claims. A roof is also the asset most likely to be deferred because its replacement cost is large and visible — exactly the wrong reason to wait. Pair roof condition scoring with seasonal freeze-thaw alerts and you eliminate the majority of building-wide cascade events. To set that up across your portfolio, Start Free Trial and import your asset list.
How does the deferral-risk score (DRS) differ from a simple age-based ranking?
Age tells you how old an asset is, not how likely it is to fail or how bad the aftermath will be. DRS combines probability of failure within 12 months, primary severity, the historical cascade multiplier, and a seasonal time-window factor. A 15-year-old backflow valve can outscore a 30-year-old floor tile by 50 points because the cascade consequence is 60× versus 2×. That reordering is what directs limited dollars to the deferrals that actually matter.
Can a CMMS quantify the cost of deferral for school board presentations?
Yes — and that is its single most valuable budget function. OXMAINT generates a cost-of-deferral report that pairs the current repair estimate with the projected post-cascade cost for every deferred work order. When a board member sees that a $340K roof deferral carries a $1.8M exposure, the funding conversation changes from "can we afford it" to "can we afford not to." Walk through a live report in 30 minutes — Book a Demo.
What size district or facility benefits from this approach?
Any facility with more than 500 assets and a deferred-maintenance backlog over $1M sees measurable ROI within the first year. The largest savings typically come from mid-size districts (8–40 buildings) where a single facilities director manages the entire portfolio manually and cascade events are discovered late. Districts with a CMMS-driven triage process report 50–60% reductions in emergency repair spend and a 35% drop in insurance claims within 12–18 months.
Your deferred-maintenance list is already a risk register. Treat it like one.
Import your asset registry, score every deferral by cascade risk, and watch emergency repair spend drop by half within a year. Free 14-day trial, full onboarding support, no credit card required.
Free 14-day trial · No credit card