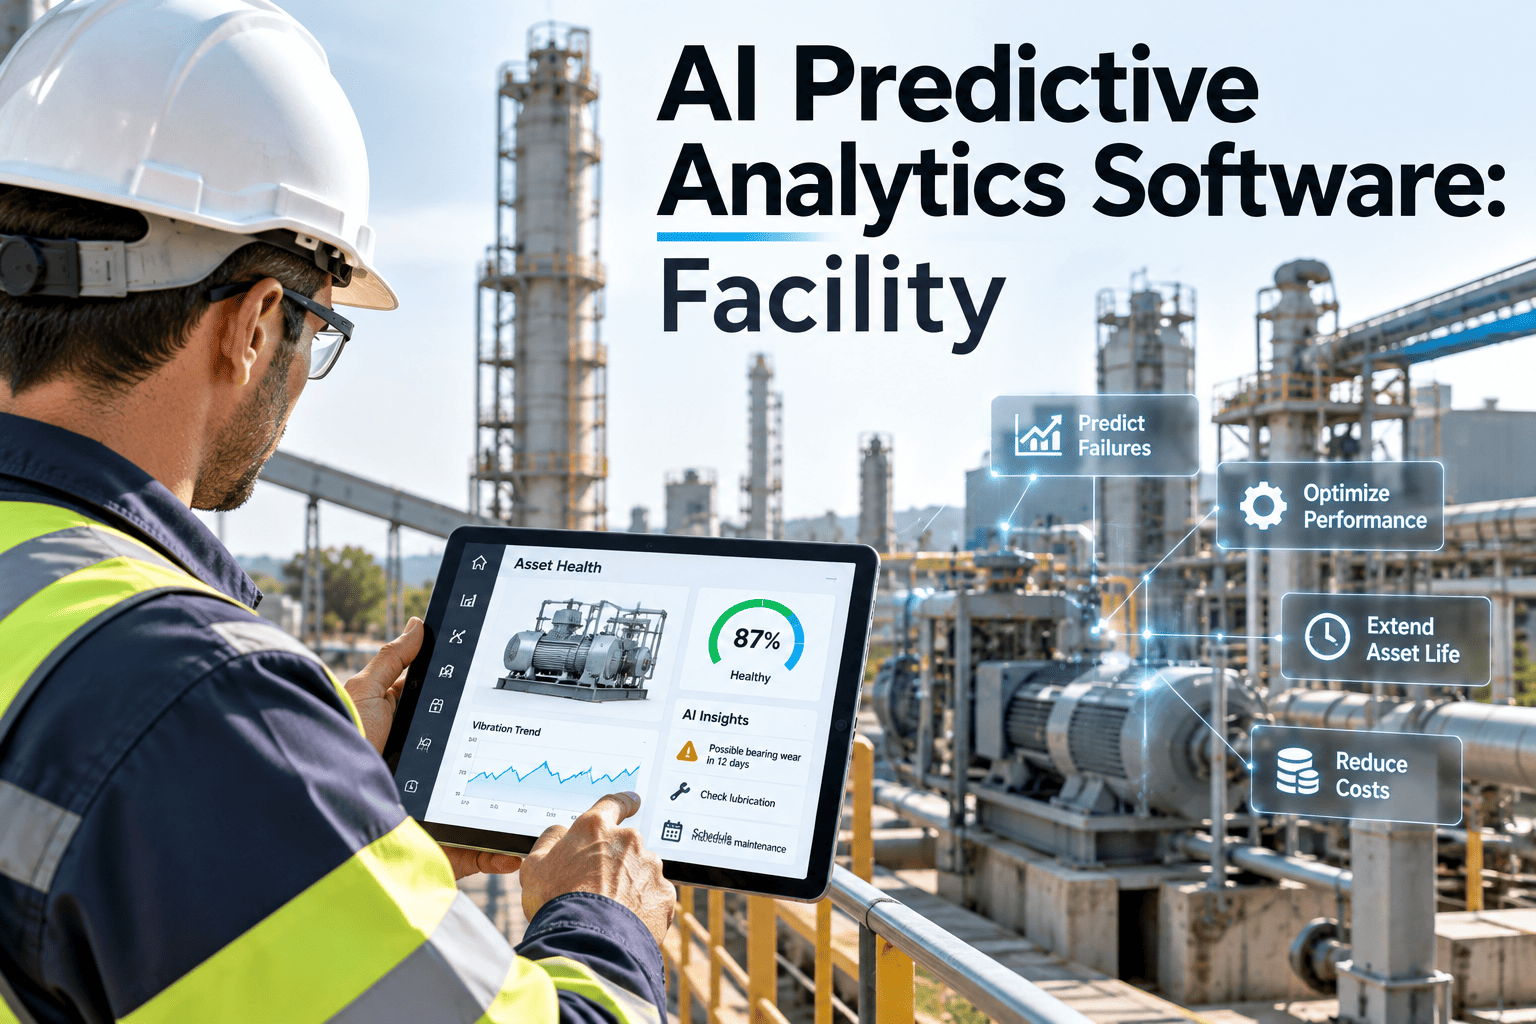
Facility equipment rarely fails without warning. Chiller bearings run warmer, air handler fans drift out of balance, pump seals leak a little more each week and UPS batteries lose capacity long before they stop carrying load. The problem is that these signals are scattered across building automation trends, sensor feeds, inspection notes and work-order history that nobody has time to correlate. AI predictive analytics software brings those signals together, flags assets that are deteriorating and gives the maintenance team time to plan. Here is how it works in real facilities and how to connect predictive insights to maintenance work in Oxmaint.
AI Predictive Analytics Software for Facilities: Detect Failures Early, Plan Repairs Before Occupants Notice
Turn sensor data, BAS trends and maintenance history into early warnings on chillers, AHUs, pumps, boilers, switchgear and UPS systems, then route every warning into a planned work order.
The P-F curve: where predictive analytics earns its value
What AI Predictive Analytics Actually Does in a Facility
Predictive analytics is often described as a black box. In practice it sits on a maturity ladder, and most facility teams climb it one step at a time. Each rung builds on the data quality of the one below.
Descriptive: what happened
Dashboards of work orders, downtime and alarm counts. Useful, but only after the failure.
Diagnostic: why it happened
Correlating failures with operating conditions, maintenance history and root cause records.
Predictive: what will happen
Anomaly detection and trend models that flag deterioration inside the P-F interval, before function is lost.
Prescriptive: what to do about it
Recommended actions, job plans and timing, delivered as a work order the team can schedule.
A useful definition
AI predictive analytics software uses statistical and machine-learning methods on condition and operating data to estimate which assets are likely to fail, roughly when, and why. Its value depends on whether the output reaches a technician in time to act.
Facility Assets Where Predictive Analytics Delivers Early Warning
Predictive methods work best on assets with measurable degradation and a warning period long enough to plan a response. The table maps common facility equipment to the signals and failure modes teams typically monitor.
| Asset | Signals commonly monitored | Failure modes analytics can flag | Relevant guidance |
|---|---|---|---|
| Chillers | Approach temperatures, compressor amps, oil pressure, refrigerant pressures, vibration | Fouled tubes, refrigerant loss, bearing wear, efficiency drift | OEM service manuals, ASHRAE Standard 180 |
| Air handling units | Fan vibration, motor current, filter differential pressure, supply temperatures, valve positions | Belt and bearing wear, imbalance, clogged filters, stuck valves or dampers | ASHRAE Standard 180 |
| Pumps | Vibration, bearing temperature, differential pressure, flow, motor current | Seal leakage, cavitation, impeller wear, misalignment | ISO 20816 vibration evaluation |
| Cooling towers | Gearbox vibration, fan motor current, basin temperature, water treatment readings | Gearbox wear, fan imbalance, scaling and fouling | OEM guidance, local water management plans |
| Boilers | Flue gas temperature, combustion readings, stack draft, water chemistry | Scaling, burner drift, tube fouling, combustion inefficiency | Jurisdictional boiler inspection rules |
| Switchgear and panels | Infrared thermography, temperature sensors, partial discharge where fitted | Loose connections, overheating terminations, insulation deterioration | NFPA 70B |
| UPS and batteries | Cell voltage, internal resistance or impedance, temperature | Cell degradation, thermal issues, reduced runtime | IEEE 1188 for VRLA batteries |
| Standby generators | Run-test data, coolant and oil condition, battery voltage, block heater status | Starting failures, fuel and cooling issues | NFPA 110 |
Why the P-F Interval Decides Whether Predictions Are Useful
The P-F interval is the time between the moment a failure becomes detectable and the moment the asset loses function. Predictive analytics only helps if detection plus response fit inside that window.
Detect
Data collection frequency must be shorter than the P-F interval, or the warning is missed between readings.
Decide
The alert must be reviewed, confirmed and prioritized quickly, ideally with asset criticality attached.
Plan
Parts, labor, permits and shutdown windows are arranged through a scoped work order.
Act
Repair happens on a planned basis before functional failure, and the outcome is recorded for model feedback.
What this means for software selection
A model that predicts accurately but delivers alerts to an inbox nobody monitors has an effective P-F interval of zero. Integration with work orders and mobile notifications matters as much as the analytics.
The Real Pain Points FM Directors Face with Predictive Programs
Most predictive analytics initiatives in facilities do not fail on algorithms. They fail on data, trust and workflow. The pairs below show the recurring problems and practical ways to address them.
Alert fatigue
Too many low-value alarms from the BAS and sensors, so technicians start ignoring all of them.
Mitigation
Filter alerts by asset criticality, require persistence before alerting and review thresholds regularly.
Data silos
BAS trends, meter data, inspection records and work orders live in separate systems with different asset names.
Mitigation
Standardize asset IDs across systems and make the CMMS asset register the reference point.
Thin failure history
Machine-learning models need labeled failures, but most facilities have vague work-order descriptions.
Mitigation
Adopt consistent failure codes now, and start with anomaly detection that does not require labeled history.
Sensor coverage gaps
Critical assets lack vibration or temperature sensors, so the model cannot see the failure developing.
Mitigation
Instrument Tier A assets first and use route-based inspections to cover the rest.
Low trust in predictions
Technicians doubt alerts they cannot explain, especially after a few false positives.
Mitigation
Show the trend behind each alert, record confirmed and false findings, and tune openly.
No path to action
Insights sit in an analytics dashboard disconnected from scheduling and labor planning.
Mitigation
Generate work orders from confirmed alerts, with job plans and priority attached.
Close the Gap Between a Prediction and a Planned Repair
Oxmaint links condition data and inspections to automated work orders, so an early warning becomes a scheduled job with the right technician, parts and priority.
Rule-Based Thresholds vs. Statistical Anomaly Detection vs. Machine Learning
"AI" covers a range of techniques. Each has strengths and limits, and mature programs usually combine them rather than choosing one.
| Approach | How it works | Strengths | Limitations | Best fit |
|---|---|---|---|---|
| Fixed thresholds | Alert when a reading crosses a set limit | Simple, transparent, easy to audit | Ignores operating context; late or noisy alerts | Safety limits, code-required alarms |
| Statistical anomaly detection | Learns a normal baseline and flags deviations | Needs no failure labels; adapts to each asset | Flags change, not cause; needs tuning | Assets with steady sensor data and little history |
| Supervised machine learning | Trained on past failures to recognize precursors | Can estimate failure type and timing | Needs quality labeled history; harder to explain | Large fleets of similar assets with good records |
| Physics or engineering models | Compares performance with expected design behavior | Explains why performance is drifting | Requires engineering setup per asset type | Chiller efficiency, heat exchanger fouling |
Data Readiness Checklist Before You Deploy Predictive Analytics
Predictions are only as good as the data behind them. Use this checklist to judge whether a building or campus is ready, and what to fix first.
Asset foundation
- Complete asset register with consistent IDs and locations
- Criticality ranking so alerts can be prioritized
- QR tags or labels linking physical assets to records
Condition data
- Sensors or BAS points mapped to the right assets
- Sampling frequency shorter than the expected P-F interval
- Time-synchronized readings with clear units
Maintenance history
- Work orders with failure codes, not just free text
- Recorded cause and corrective action on closeout
- PM and inspection results captured digitally
Workflow and ownership
- A named owner who reviews and confirms alerts
- Rules for when an alert becomes a work order
- Feedback loop marking alerts as true or false
From Insight to Action: The Predictive Maintenance Workflow in a CMMS
The workflow below shows how a predictive signal should travel through a facility maintenance operation. Every step produces a record, which is what makes the program measurable and auditable.
Collect
IoT sensors, BAS points and mobile inspections feed readings to the asset record.
Detect
Thresholds, trends or models flag a reading that departs from normal behavior.
Confirm
A technician verifies with a follow-up inspection, thermography or manual reading.
Plan
A corrective work order is created with priority, job steps, parts and scheduling.
Execute
Work is completed on mobile, with findings, photos and readings captured on site.
Learn
Closeout codes and RCA results refine thresholds and future predictions.
A Phased Rollout Plan for Facility Predictive Analytics
Trying to instrument an entire portfolio at once usually stalls. A phased plan proves value on a small scope and builds the data discipline needed for broader coverage. Timelines vary by site, so treat the phases as sequence, not fixed durations.
Phase 1: Foundation
Clean the asset register, rank criticality, standardize failure codes and move inspections to digital checklists.
Phase 2: Pilot
Connect sensors or BAS data on a handful of Tier A assets, such as a chiller plant or main AHUs, and route alerts to work orders.
Phase 3: Tune
Review every alert outcome, adjust thresholds and baselines, and document which signals gave useful warning.
Phase 4: Scale
Extend to similar assets and sites, rebalance time-based PM where condition data proves it safe, and report results.
KPIs to Measure a Predictive Analytics Program
Measure the program on maintenance outcomes, not on the number of alerts produced. These metrics show whether predictions are turning into reliability.
Alert precision
Share of alerts confirmed as real developing faults after inspection.
Warning lead time
Time between the first alert and the planned repair date.
Unplanned failures on monitored assets
Failures that happened without any prior alert, which point to coverage gaps.
Planned maintenance ratio
Proportion of labor hours spent on planned rather than reactive work.
Alert-to-work-order time
How quickly confirmed alerts become scheduled jobs.
MTBF on monitored assets
Mean time between failures trended over time for instrumented equipment.
Predictive Analytics Priorities by Facility Type
The same analytics techniques apply everywhere, but the assets that matter most, and the consequences of missing a warning, change with the type of facility. Use this view to decide where your first models should focus.
Data centers
Cooling units, chillers, UPS batteries, switchgear and generators dominate risk. Warnings on battery internal resistance and cooling performance protect uptime commitments, and redundancy status must be part of every alert decision.
Hospitals and healthcare
Air handling for critical areas, medical gas support systems, emergency power and domestic hot water are priorities. Early warnings help keep pressure relationships, temperatures and backup power within the requirements regulators inspect.
Commercial offices
Central plant, AHUs, VAV systems and elevators drive tenant comfort and complaints. Analytics on energy and performance drift often pays off as much through efficiency as through avoided failures.
Campuses and universities
Large, mixed-age portfolios make prioritization the main challenge. Predictive programs usually begin on central utility plants and research buildings, then extend to high-occupancy spaces.
Industrial and plant utilities
Compressed air, process cooling, pumps, motors and electrical distribution support production. Vibration and thermography data on rotating equipment gives long warning periods that suit planned shutdowns.
Questions to Ask Before Choosing AI Predictive Analytics Software
Vendor demos tend to show clean data and perfect alerts. These questions help you test how a platform will behave with your real buildings and your real team.
- Which data sources can it ingest today, and how are BAS points and sensors mapped to assets?
- Can technicians see the trend and reasoning behind each alert, not just a risk score?
- How are false positives recorded and used to tune thresholds or models?
- Do confirmed alerts create work orders automatically, with priority set by criticality?
- Does the mobile app work offline in plant rooms, basements and rooftops with poor signal?
- Can results be reported across multiple sites for leadership and compliance reviews?
- How does the platform handle assets with no sensors, such as route-based readings entered during inspections?
- What happens to your asset history, readings and work-order data if you change platforms later?
How Oxmaint Supports Predictive and Condition-Based Maintenance
Oxmaint is a cloud-based CMMS that gives facility teams the workflow layer predictive programs need. It focuses on turning condition data into accountable maintenance work.
IoT sensor integration
Bring condition readings into asset records so trends sit beside maintenance history.
Condition-triggered work orders
Automate work orders when readings or inspection results indicate a developing fault.
Digital inspections
Mobile checklists capture readings and findings, including offline in plant rooms and rooftops.
Root cause analysis
Log causes and corrective actions so every failure improves future detection.
Dashboards and reports
Track planned work, asset performance and compliance records across sites.
Multi-site visibility
One view of critical assets across campuses, data centers and remote facilities.
AI Predictive Analytics Software FAQs
What is AI predictive analytics in facility maintenance?
It applies statistical and machine-learning methods to sensor, BAS and maintenance data to flag assets likely to fail, so repairs can be planned before function is lost.
Do we need years of failure history to start?
No. Anomaly detection learns normal behavior without labeled failures. Consistent failure coding from today will strengthen more advanced models later.
Which facility assets should we monitor first?
Start with critical assets that have a detectable warning period, such as chillers, main AHUs, critical pumps, switchgear and UPS batteries.
How do predictions become maintenance work?
Confirmed alerts should generate prioritized work orders in the CMMS. You can set up condition-based workflows in Oxmaint on a pilot asset group.
How do we avoid alert fatigue?
Filter by asset criticality, require readings to persist before alerting and track false positives. Book a demo to review an alert workflow.
See Failures Coming and Schedule the Fix
Start with one critical system, connect its condition data to work orders and build a predictive program your technicians trust.





