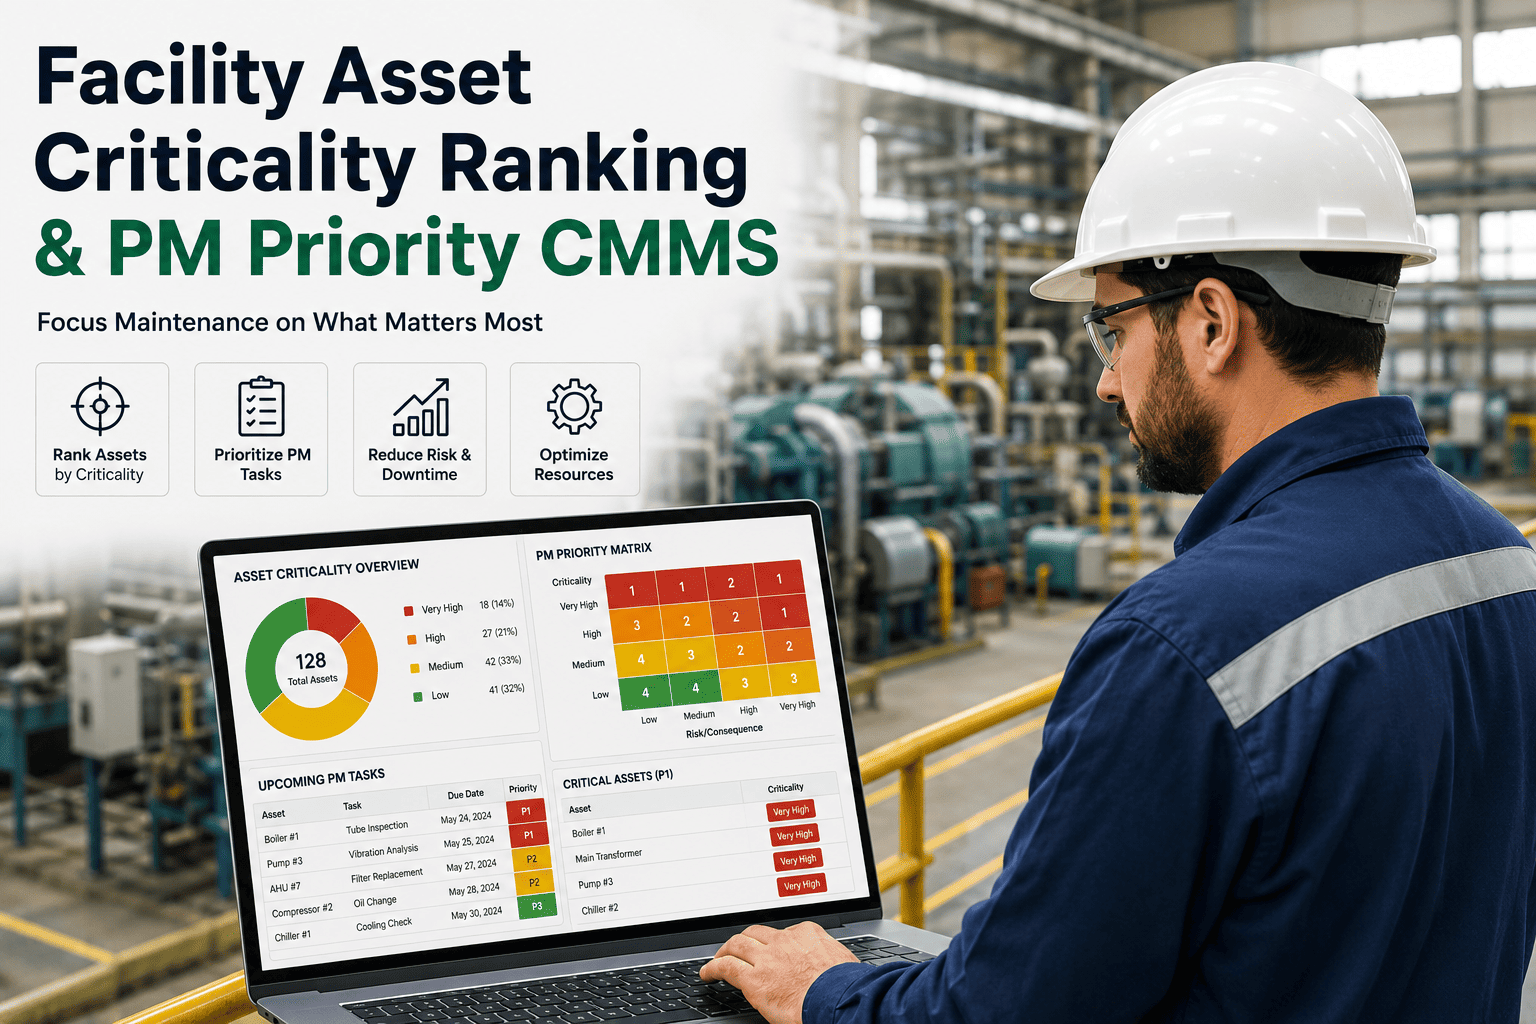
Asset criticality ranking decides where a maintenance team spends its limited labor, spares budget and condition-monitoring effort. Without a defensible ranking, every asset looks urgent, preventive maintenance gets spread evenly across equipment that does not deserve it, and the machines that can actually shut down a facility get the same attention as a restroom exhaust fan. Reliability-centered maintenance depends on getting this step right first. This guide explains how criticality scoring works, how it feeds RCM decisions, and how asset criticality software in Oxmaint turns a one-time spreadsheet exercise into a living maintenance strategy.
Asset Criticality Ranking Software: Build the RCM Foundation Every Maintenance Decision Depends On
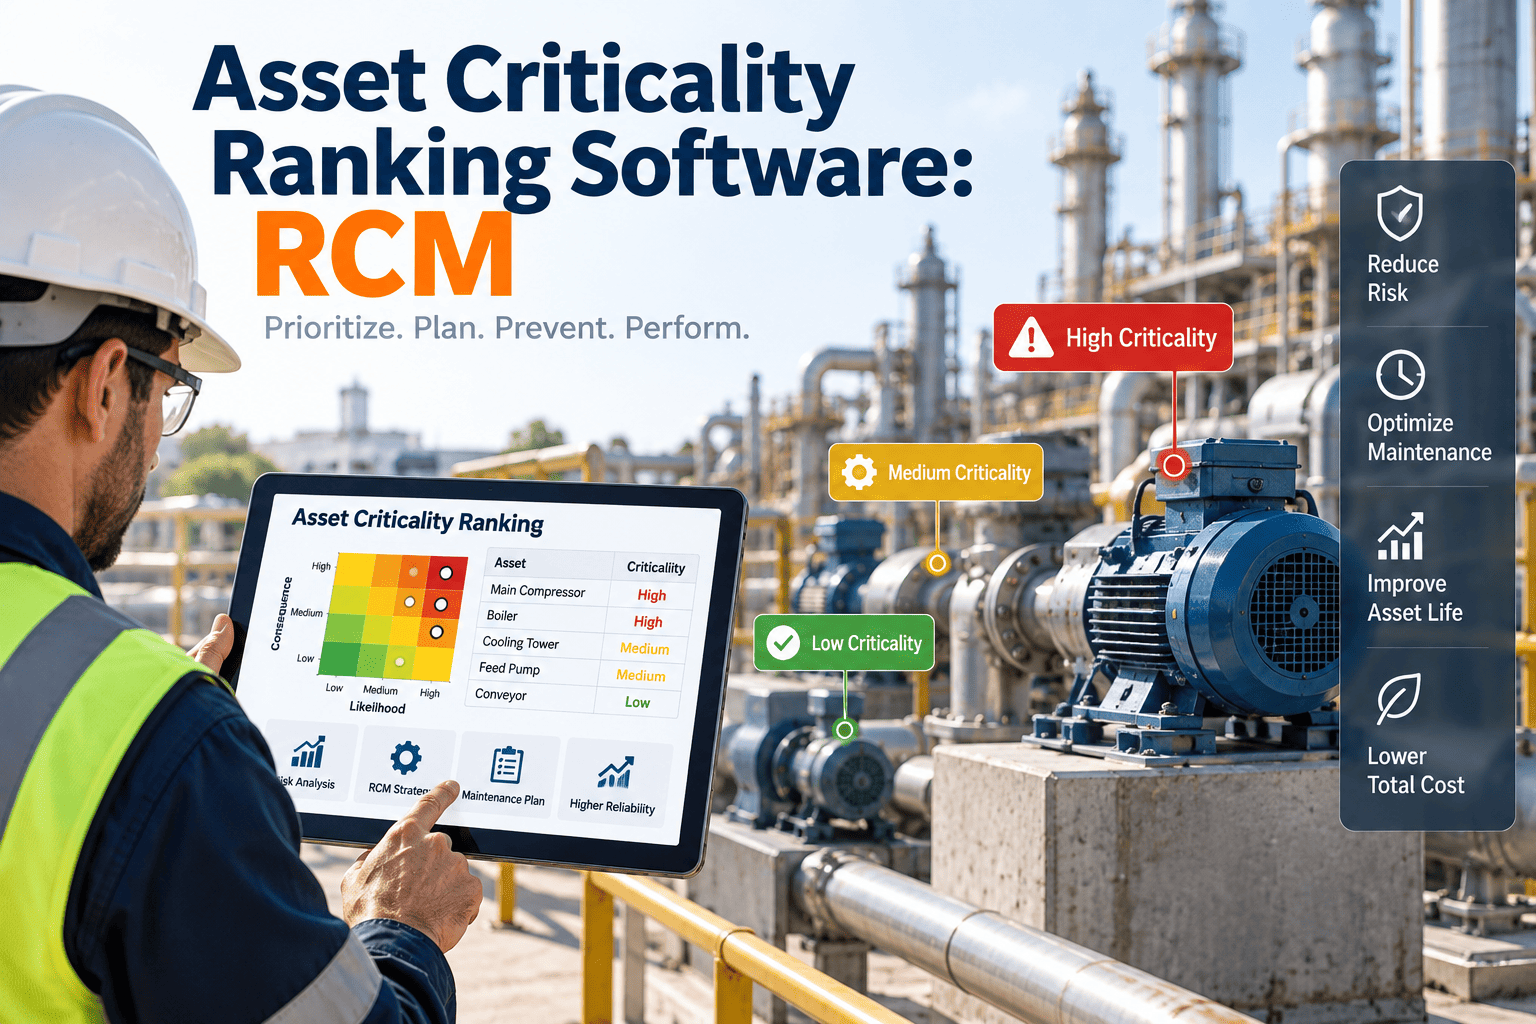
Score every asset on safety, environmental, compliance and operational consequence, then let that ranking drive PM depth, work-order priority, critical spares and monitoring frequency inside one CMMS.
Consequence × likelihood risk matrix
Why Facilities Without a Criticality Ranking Stay in Firefighting Mode
When criticality is undefined, priorities default to asset age, habit and whoever reports the problem loudest. These symptoms appear in almost every facility that skips the ranking step.
Every work order is marked high priority
Priority codes stop carrying meaning. Planners cannot sequence the backlog, and a failed chiller competes with a squeaky door closer for the same technician.
PM tasks are applied uniformly
Low-risk assets are over-maintained while critical ones are under-covered. Unnecessary intrusive PM can even introduce new failures through disturbed seals, connections and alignments.
Spares are stocked by habit
Long-lead parts such as compressor components, drive boards, breakers and custom seals are missing when needed, while storerooms carry slow-moving commodity items.
Condition monitoring covers whatever is convenient
Vibration routes, thermography and oil sampling land on accessible equipment rather than on the assets whose failure would stop operations or create safety exposure.
Capital plans are argued by age alone
Replacement budgets go to the oldest equipment instead of the riskiest. Leadership sees a list of old assets, not a ranked picture of business exposure.
Auditors ask how decisions link to risk
ISO 55001 assessors, insurers and internal reliability reviews expect a traceable line from risk to maintenance plan. A three-year-old spreadsheet rarely provides it.
The Consequence Dimensions a Criticality Model Should Score
A good criticality model asks one question from several angles: if this asset fails in its current operating context, how bad is it and how likely is it? Each dimension below needs a written scale so two scorers reach the same answer.
| Dimension | What it measures | Scoring question to anchor the scale | Facility examples |
|---|---|---|---|
| Safety and health | Potential for injury, illness or exposure | Could failure injure occupants, visitors or staff? | Fire pumps, emergency lighting, elevators, gas detection |
| Environmental | Release, spill or emissions potential | Could failure cause a reportable release? | Refrigerant circuits, fuel tanks, cooling towers, grease interceptors |
| Regulatory and compliance | Legal or code obligations tied to the asset | Would failure breach a code, permit or inspection requirement? | Generators under NFPA 110, sprinklers under NFPA 25, backflow preventers |
| Operational impact | Effect on the service the building delivers | How much of the facility loses function, and for how long? | Chillers, main switchgear, UPS, data room cooling, process air |
| Redundancy | Whether a standby path exists and is proven | Is there an installed, tested backup that takes over automatically? | N+1 pump sets, dual boilers, paralleled generators |
| Quality and service level | Effect on tenants, patients, product or SLA | Would failure trigger complaints, penalties or lost product? | Cleanroom AHUs, cold rooms, pharmacy refrigeration |
| Repair cost and MTTR | Cost and duration to restore function | How long and how expensive is a typical repair? | Large motors, transformers, cooling tower gearboxes |
| Spares lead time | Availability of replacement parts | Can the part be sourced within the tolerable outage window? | Obsolete controllers, custom impellers, switchgear components |
| Likelihood of failure | Probability based on history and condition | How often has it failed, and what does condition data say now? | Assets with repeat work orders or deteriorating readings |
Three Ways to Calculate an Asset Criticality Score
There is no single correct formula. The right method is the one your team can apply consistently and explain to an auditor. Most facility programs use one of these three approaches.
Weighted sum
Each dimension is scored on a 1–5 scale and multiplied by an agreed weight. Simple to explain, but a high safety score can be diluted by low scores elsewhere unless overrides are built in.
Risk priority
The worst credible consequence is multiplied by likelihood, as in the matrix above. This aligns with ISO 31000 risk thinking and makes it easy to plot assets on a heat map.
Decision tree
Ordered yes/no questions assign a tier directly. Any credible safety or environmental consequence forces the top tier regardless of other scores, which prevents dangerous dilution.
Practical recommendation
Many teams combine methods: a weighted or risk score for ranking, plus decision-tree overrides for safety, environmental and regulatory consequences. Whatever you choose, document the scales and weights inside your CMMS so scores are repeatable.
A Six-Step Criticality Ranking Workflow
Criticality analysis is a structured process, not a meeting where people vote on favorite assets. The sequence below keeps the ranking defensible and maintainable.
-
1
Build a clean asset hierarchy
Structure the register from site to system to equipment to maintainable item, using a taxonomy such as ISO 14224. Rank at the equipment level where maintenance decisions are made.
-
2
Define scoring scales with anchors
Write what each score means in your facility's terms, for example which level equals a partial building outage versus a full tenant shutdown. Vague scales produce inconsistent rankings.
-
3
Run a cross-functional scoring session
Include maintenance, operations, EHS, engineering and finance. Operations knows the business impact, technicians know the failure history, and EHS knows the regulatory exposure.
-
4
Calculate and check the distribution
If most assets land in the top tier, the scales are too generous and the ranking will not change behavior. Recalibrate until the top tier is genuinely selective.
-
5
Validate against history
Compare rankings with work-order history, downtime logs and operator experience. An asset that has caused repeated outages but scores low signals a scale or data problem.
-
6
Assign strategy and set review triggers
Link each tier to a maintenance strategy, then re-rank after modifications, redundancy changes, new regulations, repeat failures or a change in how the space is used.
From Criticality Tier to Maintenance Strategy
A ranking only creates value when it changes what the team does. Each tier should map to a distinct level of PM depth, response time, spares policy and monitoring. The mapping below is a starting template to adapt, not a fixed rule.
Tier A: Critical
Tier B: High
Tier C: Medium
Tier D: Low
Where Criticality Fits in Reliability-Centered Maintenance
SAE JA1011 defines the questions a process must answer to be called RCM. A full analysis is resource-intensive, so criticality ranking tells you where to apply it in depth and where a lighter PM optimization is enough.
What are the asset's functions and required performance standards in its current operating context?
In what ways can it fail to fulfill those functions?
What causes each functional failure, in other words, what are the failure modes?
What happens when each failure occurs?
In what way does each failure matter? This consequence question is where criticality scoring and RCM share the same logic.
What proactive task and interval will predict or prevent each failure?
What should be done if no suitable proactive task exists, such as redesign, a failure-finding task or run-to-failure?
How the two work together
Criticality ranks equipment. RCM and FMEA, as described in IEC 60812, then rank the failure modes inside the top-tier equipment. The output is a task list with intervals that the CMMS schedules and tracks.
Put Your Criticality Ranking Where the Work Happens
Store criticality scores on every asset record, link them to PM templates and work-order priority, and give planners a ranked backlog they can trust.
Spreadsheet Criticality vs. Criticality Inside a CMMS
Most facilities start with a spreadsheet, and that is a reasonable first draft. The problem is that a spreadsheet ranking is disconnected from the systems that schedule and execute work.
Spreadsheet ranking
- Scores live in a file that planners rarely open
- Work-order priority is set manually and inconsistently
- No link between tier and PM frequency or task depth
- Rankings go stale after equipment changes
- Failure history must be exported and matched by hand
- Hard to prove to auditors how risk drives decisions
Criticality in the CMMS
- Scores sit on the asset record every technician sees
- Work-order priority can follow asset criticality
- PM templates and inspection depth align with tier
- Change triggers prompt re-ranking in context
- Failure history sits next to the score for validation
- Reports trace risk to plan to completed work
What to Look for in Asset Criticality Ranking Software
When evaluating a criticality platform or a CMMS with criticality features, test these capabilities against your real asset register, not a vendor demo dataset.
Configurable scoring model
Your own dimensions, scales, weights and override rules, rather than a fixed vendor formula.
Hierarchy-aware ranking
Scores at system, equipment and component level, with parent-child relationships preserved.
Link to maintenance execution
Criticality influences PM schedules, work-order priority and inspection checklists directly.
Failure history in context
Work orders, downtime and root cause records visible alongside the score for validation.
Critical spares visibility
Inventory linked to Tier A and B assets so stockouts on critical parts are flagged early.
Condition data connection
IoT sensor readings and inspection results that can update likelihood and trigger work.
Audit-ready reporting
Exportable records that show how risk ranking drives the maintenance plan for ISO 55001 reviews.
Mobile access for technicians
Criticality visible in the field, so the person at the asset understands why the task matters.
How Oxmaint Turns a Criticality Ranking into Daily Maintenance Work
Oxmaint is maintenance management software that connects the ranking to the workflows that execute it. The chain below shows how criticality flows through the system.
Asset register
Assets organized by site and system, tagged with QR codes for fast lookup in the field.
Criticality on the record
Scores and tiers stored with each asset alongside lifecycle and history data.
Tiered PM and inspections
Preventive maintenance schedules and digital checklists matched to tier.
Prioritized work orders
Automated work orders with real-time notifications, sequenced by risk.
Condition signals
IoT sensor data and inspection findings that surface deterioration early.
RCA and reporting
Root cause workflows and dashboards that feed lessons back into the ranking.
KPIs That Show Whether Your Criticality Ranking Is Working
Track these indicators by tier. If Tier A performance does not improve relative to lower tiers, the ranking is not yet changing behavior.
PM compliance on Tier A
Share of scheduled critical-asset PM completed on time. This should be the highest of any tier.
Planned vs. reactive work
Proportion of critical-asset labor that was planned. Rising planned work signals control.
MTBF by tier
Mean time between failures on critical equipment, trended quarter over quarter.
Critical spares stockouts
Instances when a Tier A repair waited on parts. The target is zero.
Backlog age by tier
How long critical work waits compared to non-critical work.
Repeat failures
Failures recurring on the same asset and mode, a trigger for RCA and re-ranking.
Common Criticality Ranking Mistakes to Avoid
Most failed criticality programs share a small set of avoidable errors. Check your approach against this list before rolling it out.
- Scoring everything critical. A top tier that holds most assets gives planners no guidance at all.
- Ignoring redundancy status. A standby unit only lowers criticality if it is installed, maintained and tested.
- Ranking once and never again. Space use, occupancy, codes and equipment change, and the ranking must follow.
- Letting one department score alone. Maintenance-only rankings miss business impact; operations-only rankings miss failure behavior.
- Stopping at the score. A ranking that never changes PM plans, priorities or spares is documentation, not strategy.
Asset Criticality Software FAQs
What is asset criticality ranking in maintenance?
It is a structured scoring of each asset by the consequence and likelihood of its failure. The ranking sets PM depth, work-order priority, spares policy and where RCM is applied.
How does criticality ranking relate to RCM?
Criticality decides which equipment deserves full RCM analysis. RCM then evaluates failure modes on those assets and selects proactive tasks and intervals for each.
How often should asset criticality be reviewed?
Review it on change triggers such as modifications, redundancy changes, repeat failures or new regulations, plus a scheduled periodic review agreed with operations.
Can a CMMS replace a criticality spreadsheet?
Yes. Storing scores on asset records links them to schedules and work orders. You can set up your asset register in Oxmaint and start with one system.
Which assets should we rank first?
Start with life-safety, compliance and single-point-of-failure systems such as switchgear, chillers and fire protection. Book a demo to walk through a starting scope.
Make Every Maintenance Decision Follow Risk
Rank your assets, align PM and spares to criticality, and give your reliability program a foundation that stays current. Start with your most critical system this month.